Charts
Data visualizations and interactive figures.
Interactive Charts
Charts built with D3.js and Highcharts. Hover for details, click the legend to toggle series.
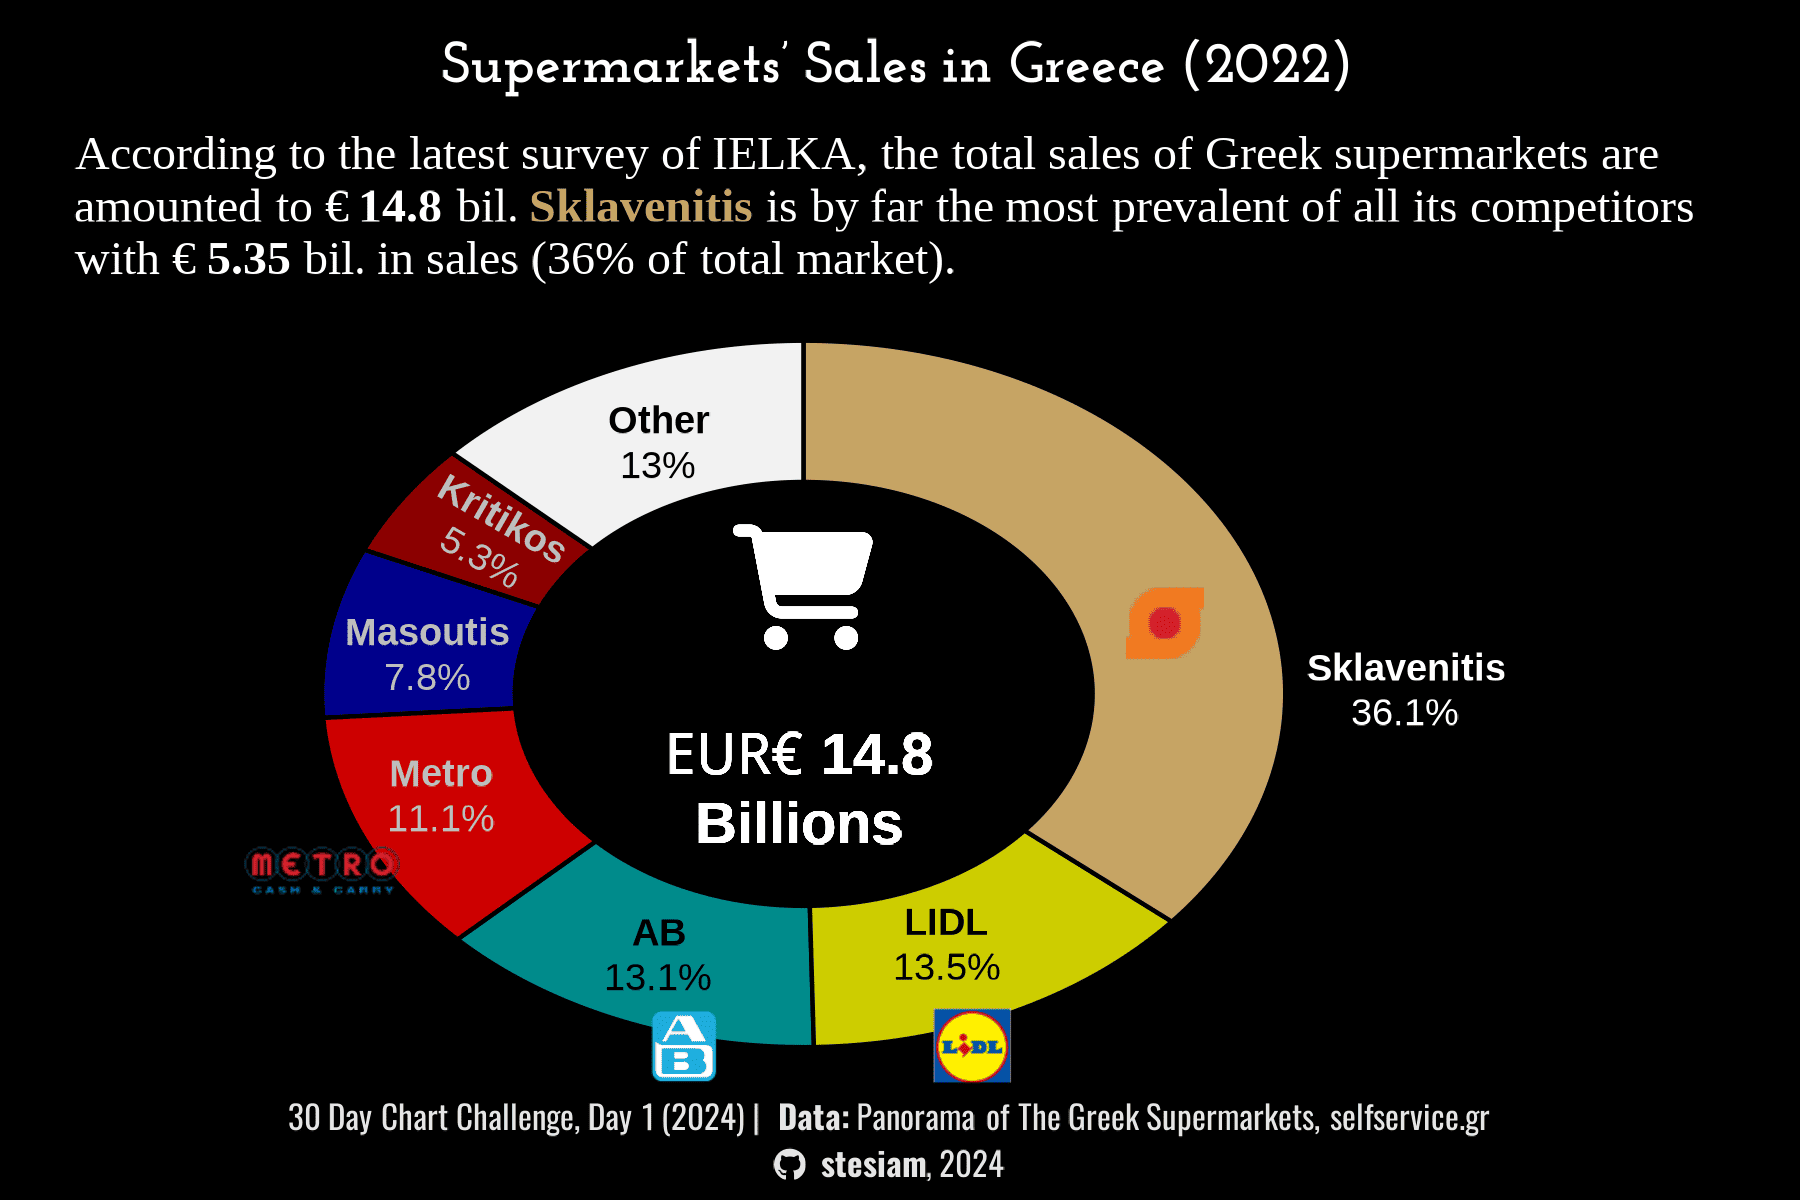
Supermarket Sales
Market share analysis of the largest supermarket chains in Greece for 2022. Sklavenitis dominates with a 36.1% share and €5.35B in revenue.
Source: ΙΕΛΚΑ — Greek Supermarket Panorama
Population Pyramid of Greece
Population distribution by age and sex from the 2021 Census. The aging population is evident, with the largest cohort in the 40–44 age group.
Source: ELSTAT — Population Census 2021
Electricity Generation by Source
Evolution of electricity generation in Greece by energy source (TWh), 2019–2023. The rapid rise of renewables and steady phaseout of lignite are clearly visible.
Source: IPTO (ΑΔΜΗΕ) — Annual System Report
Employment by Economic Sector
Employed persons by economic sector in Greece (thousands), 2019–2023. The tertiary sector dominates with over 70% of total employment.
Source: ELSTAT — Labour Force Survey
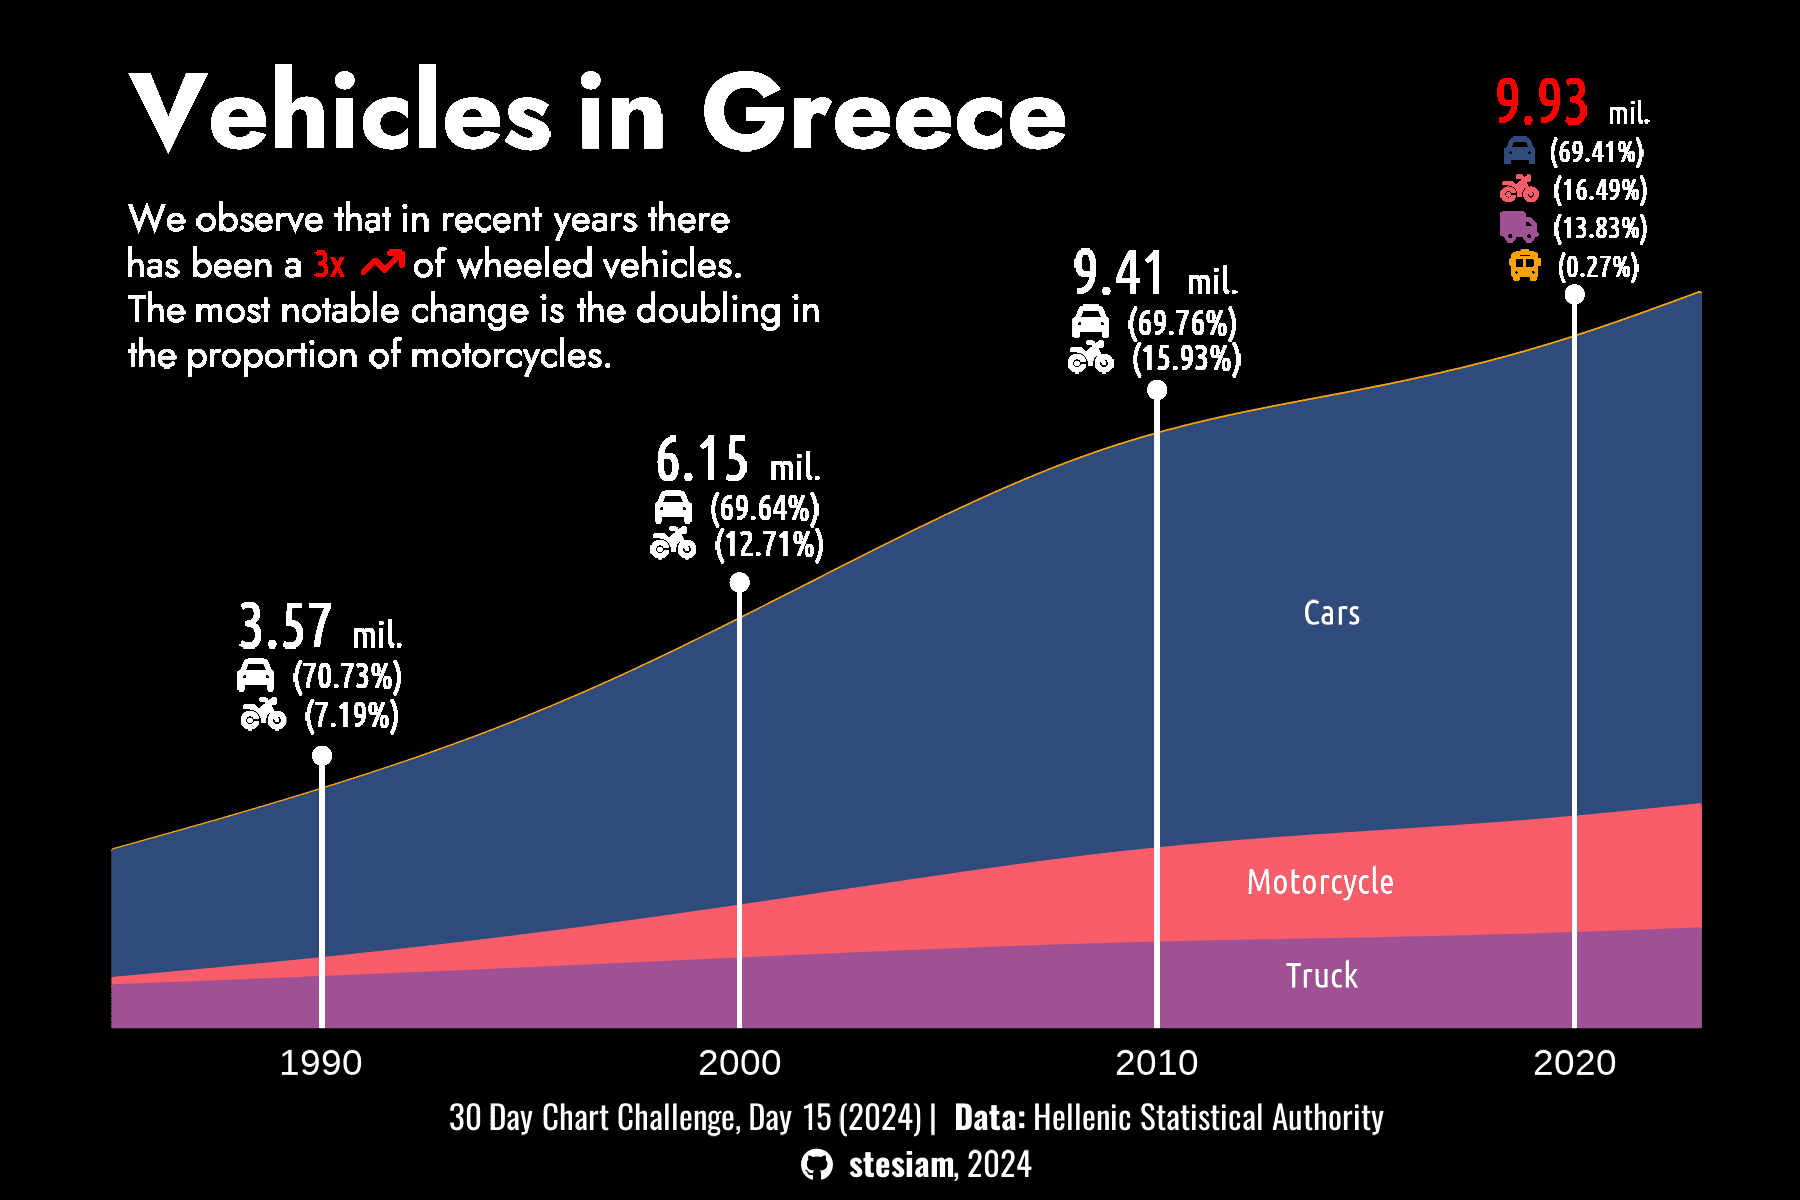
Registered Vehicles by Category in Greece
Evolution of registered vehicles in Greece by category, 1990–2020. Motorcycles saw a remarkable +538% increase while buses remained nearly flat.
Source: ELSTAT — Registered Vehicles Registry
Statistical Software Popularity
Monthly Google Trends index (0–100) for MATLAB, R, and SPSS, 2005–2024. R overtook MATLAB around 2013 and has remained dominant since.
Source: Google Trends
Greek Trade Flows — Imports & Exports
Greece's imports (left) and exports (right) by region (2022). Imports of €88.5bn far exceed exports of €54.5bn. The Trade Deficit node absorbs the €34bn gap.
Source: ELSTAT — External Trade Statistics (2022)
Static Charts
Day 1
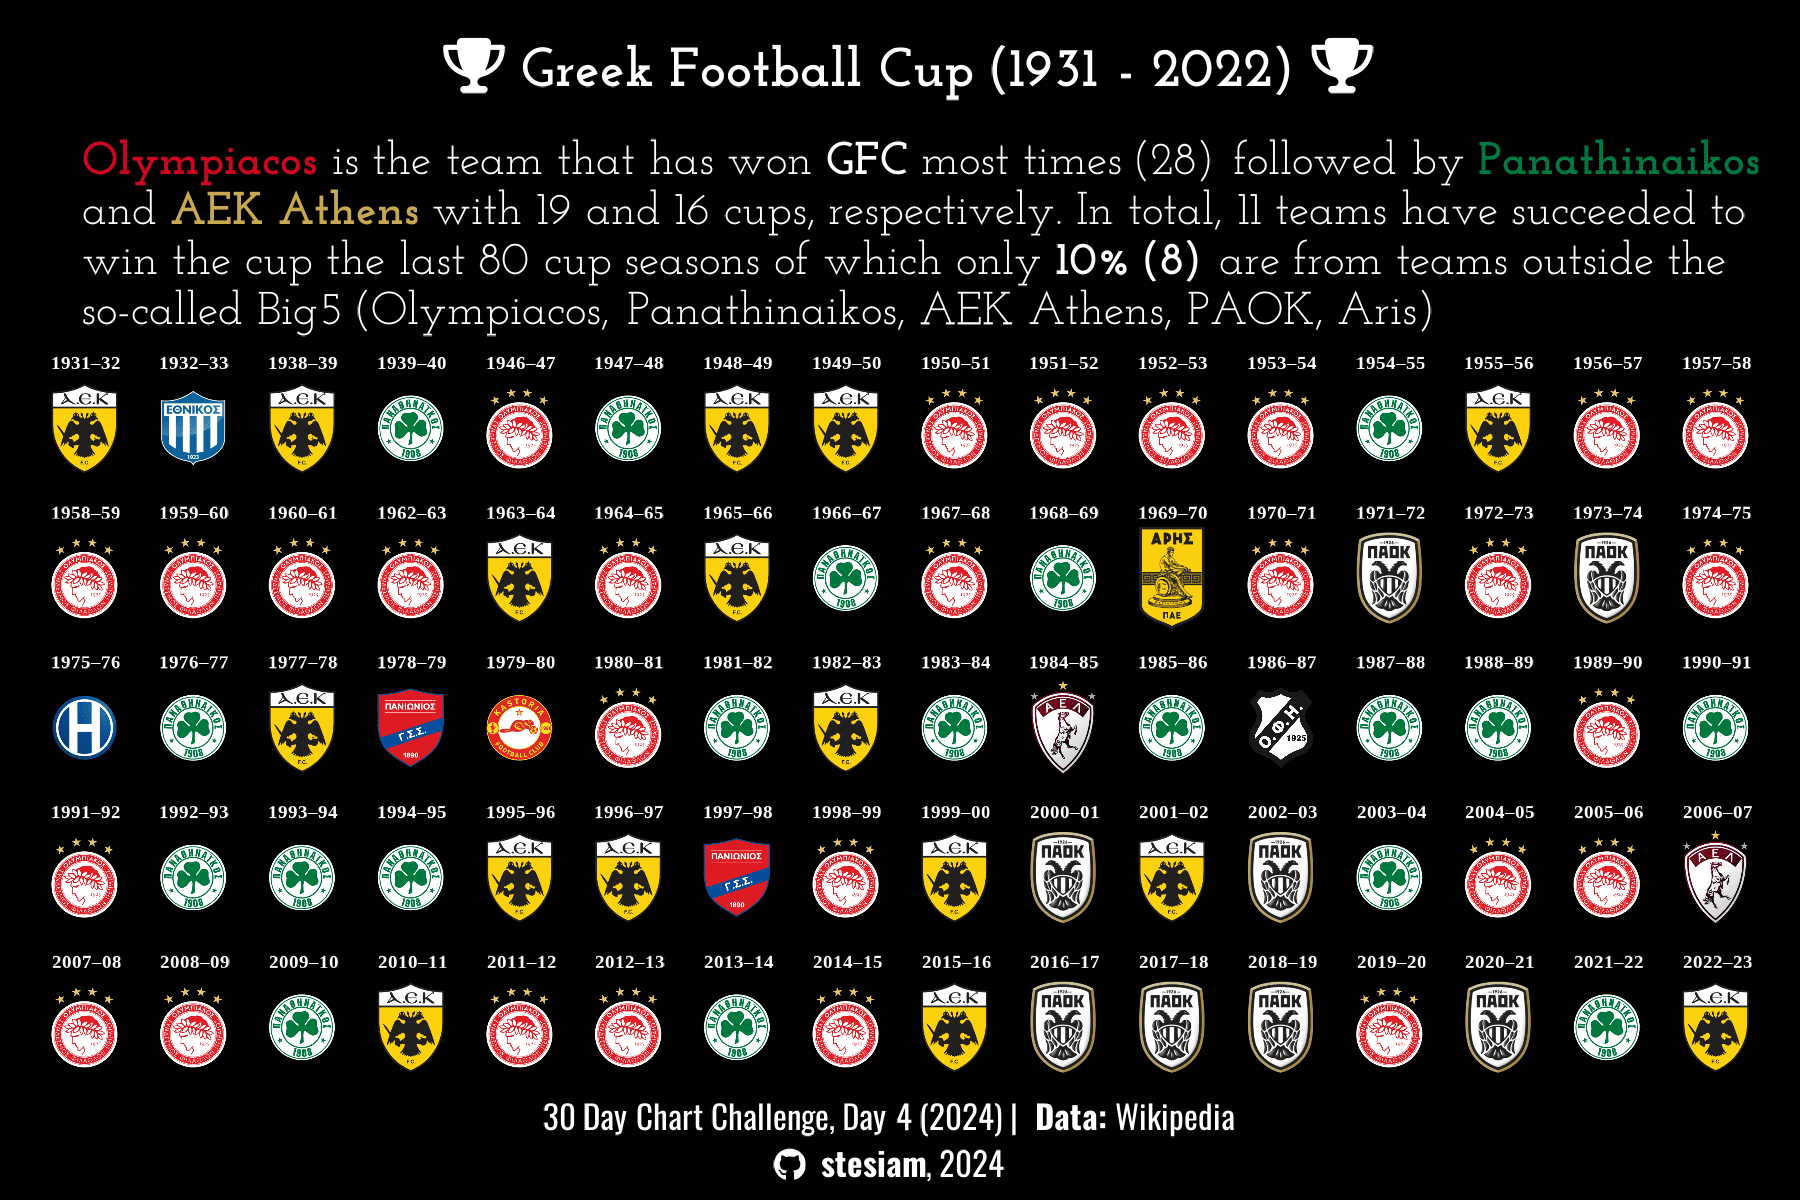
Day 4
Day 15
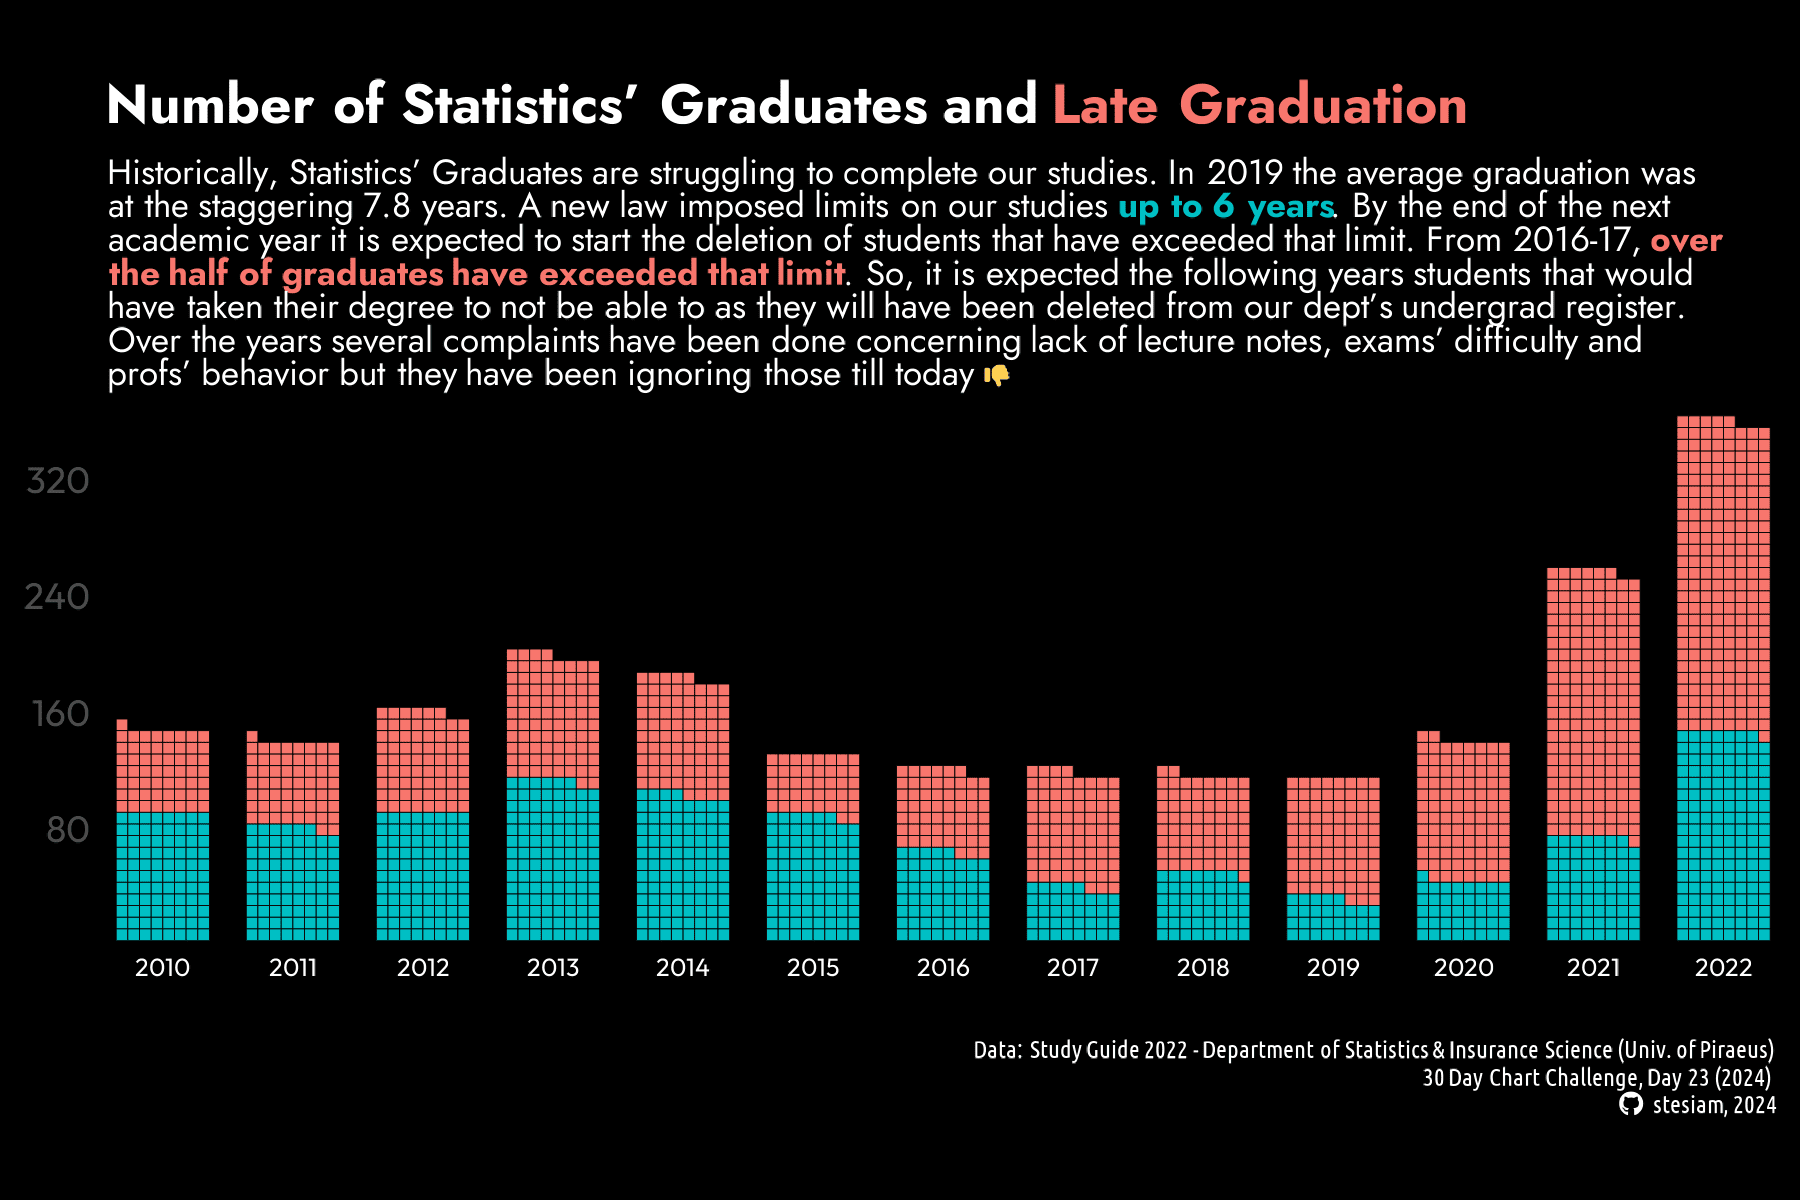
Day 23
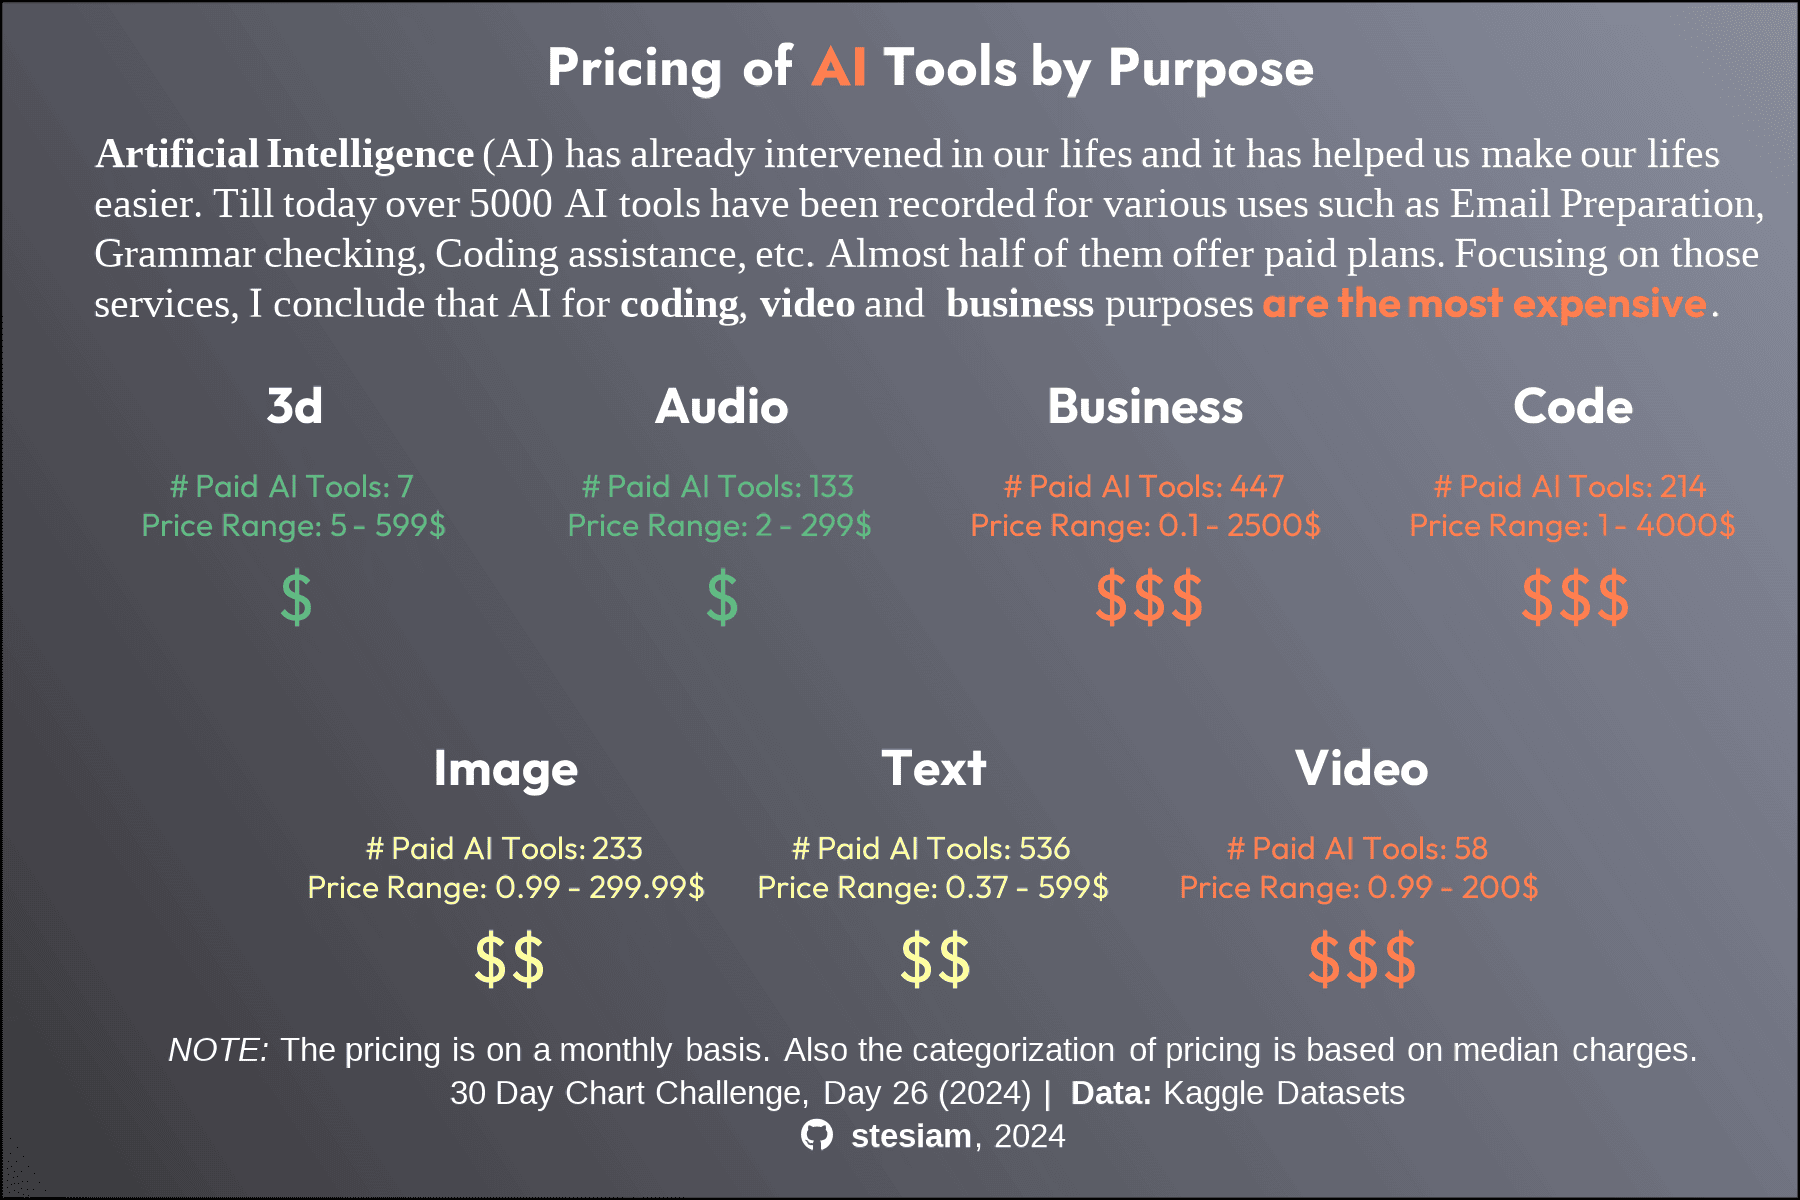
Day 26
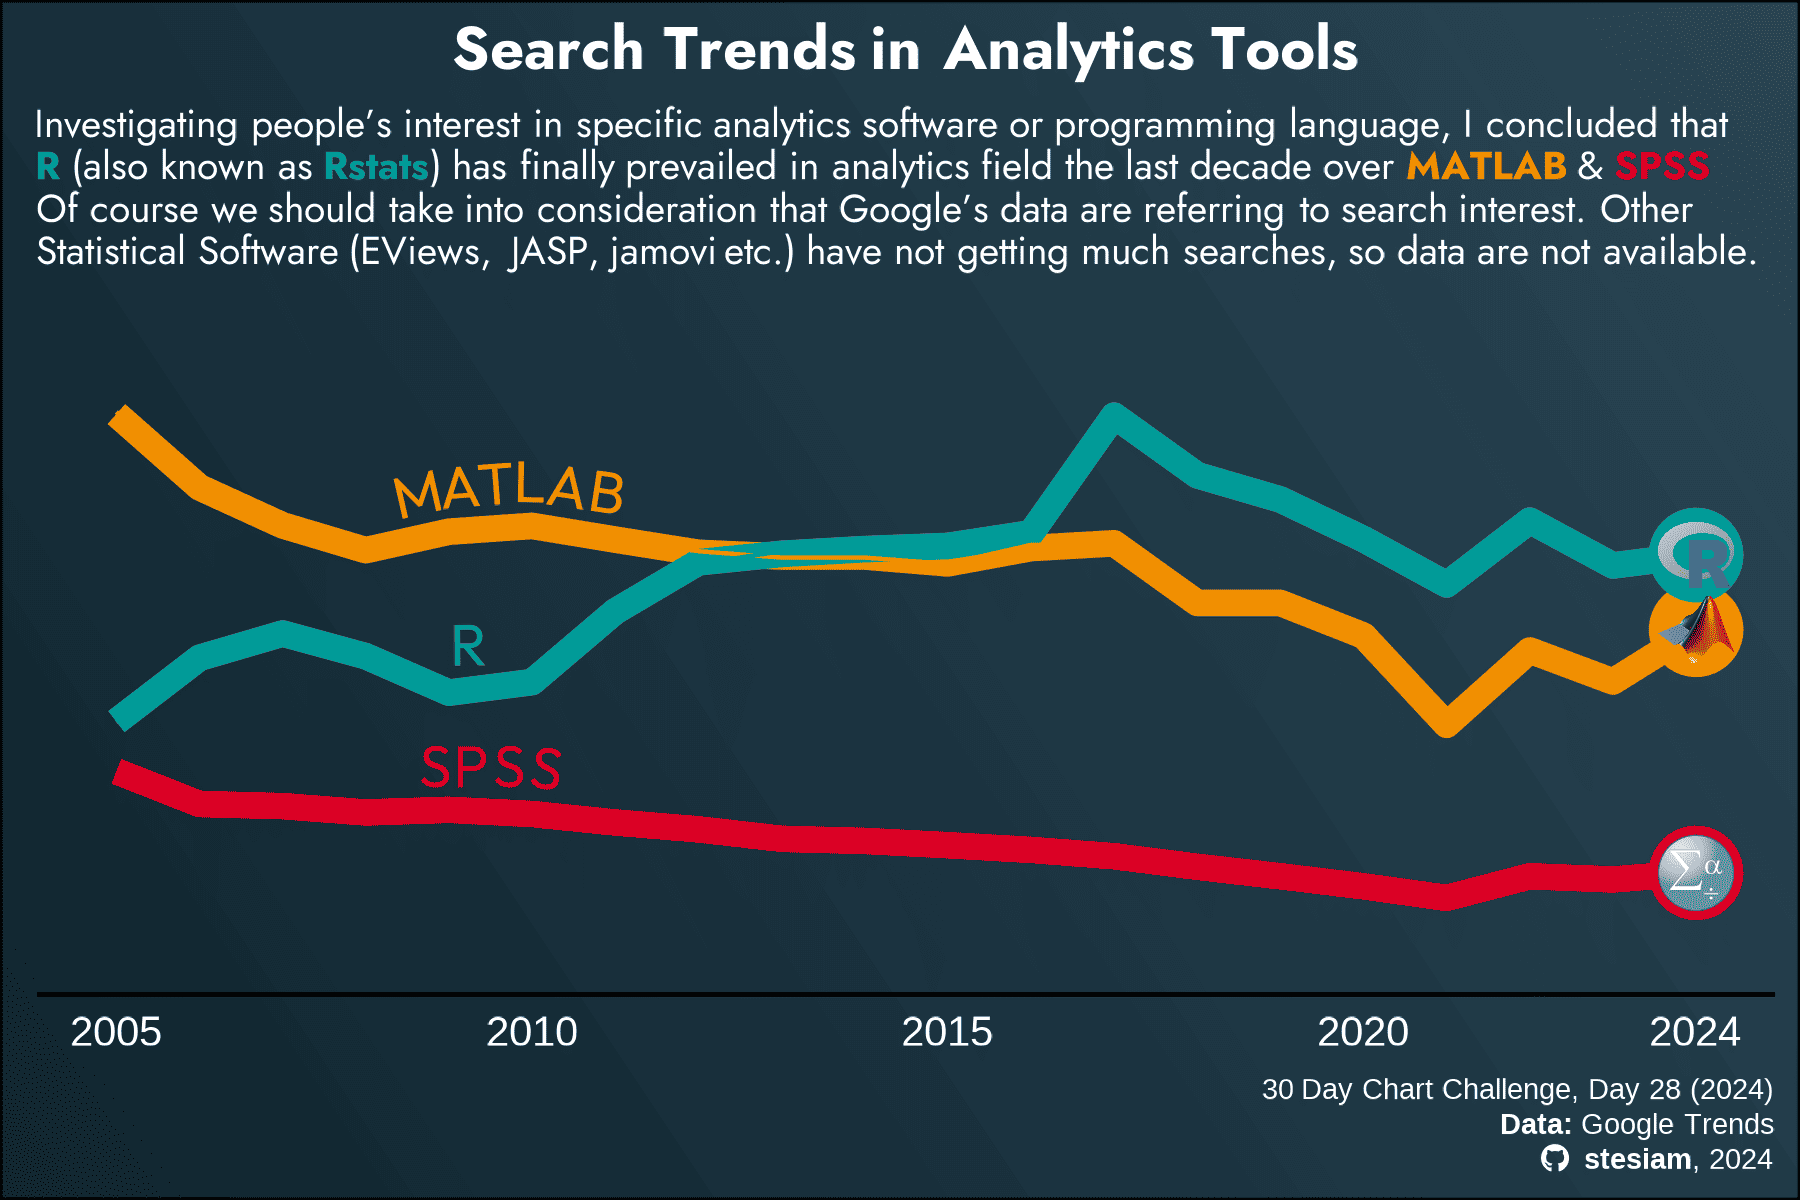
Day 28
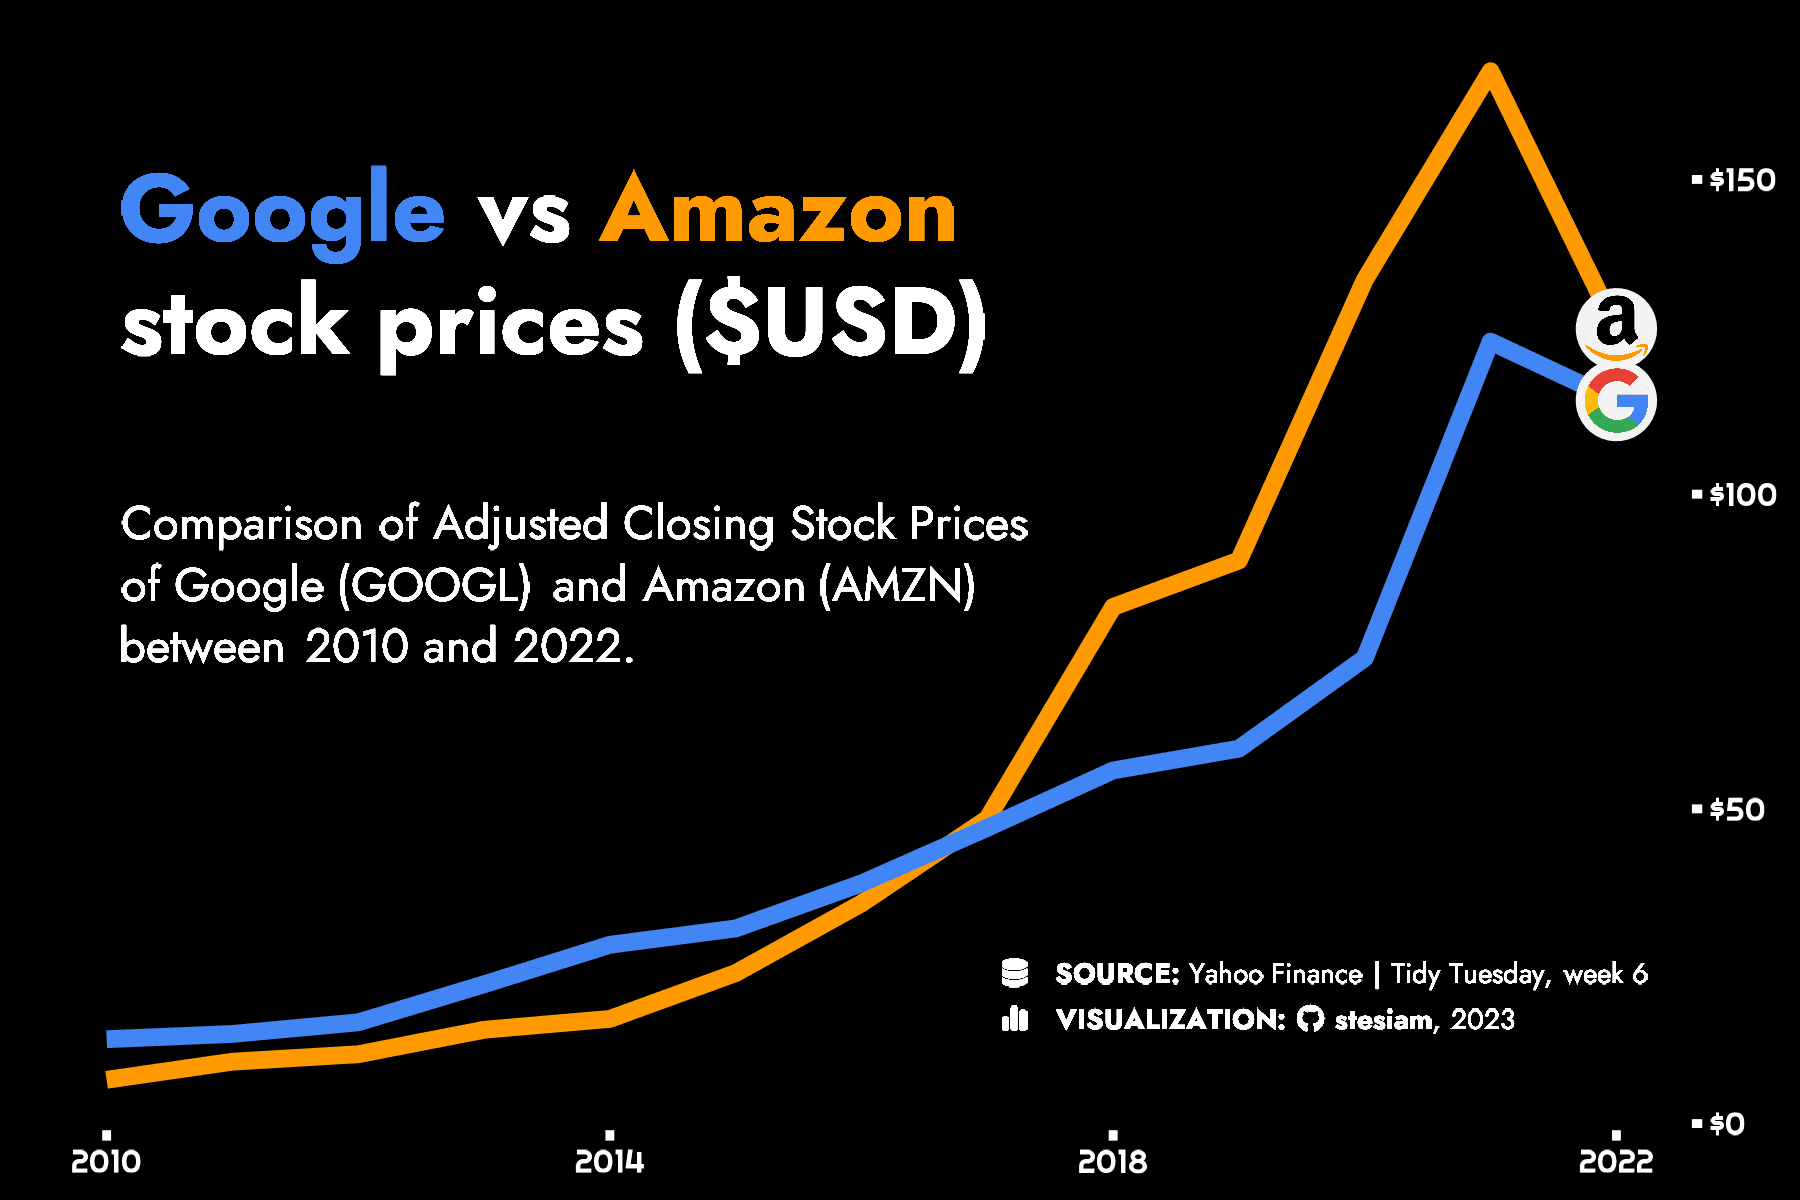
Week 6, 2023
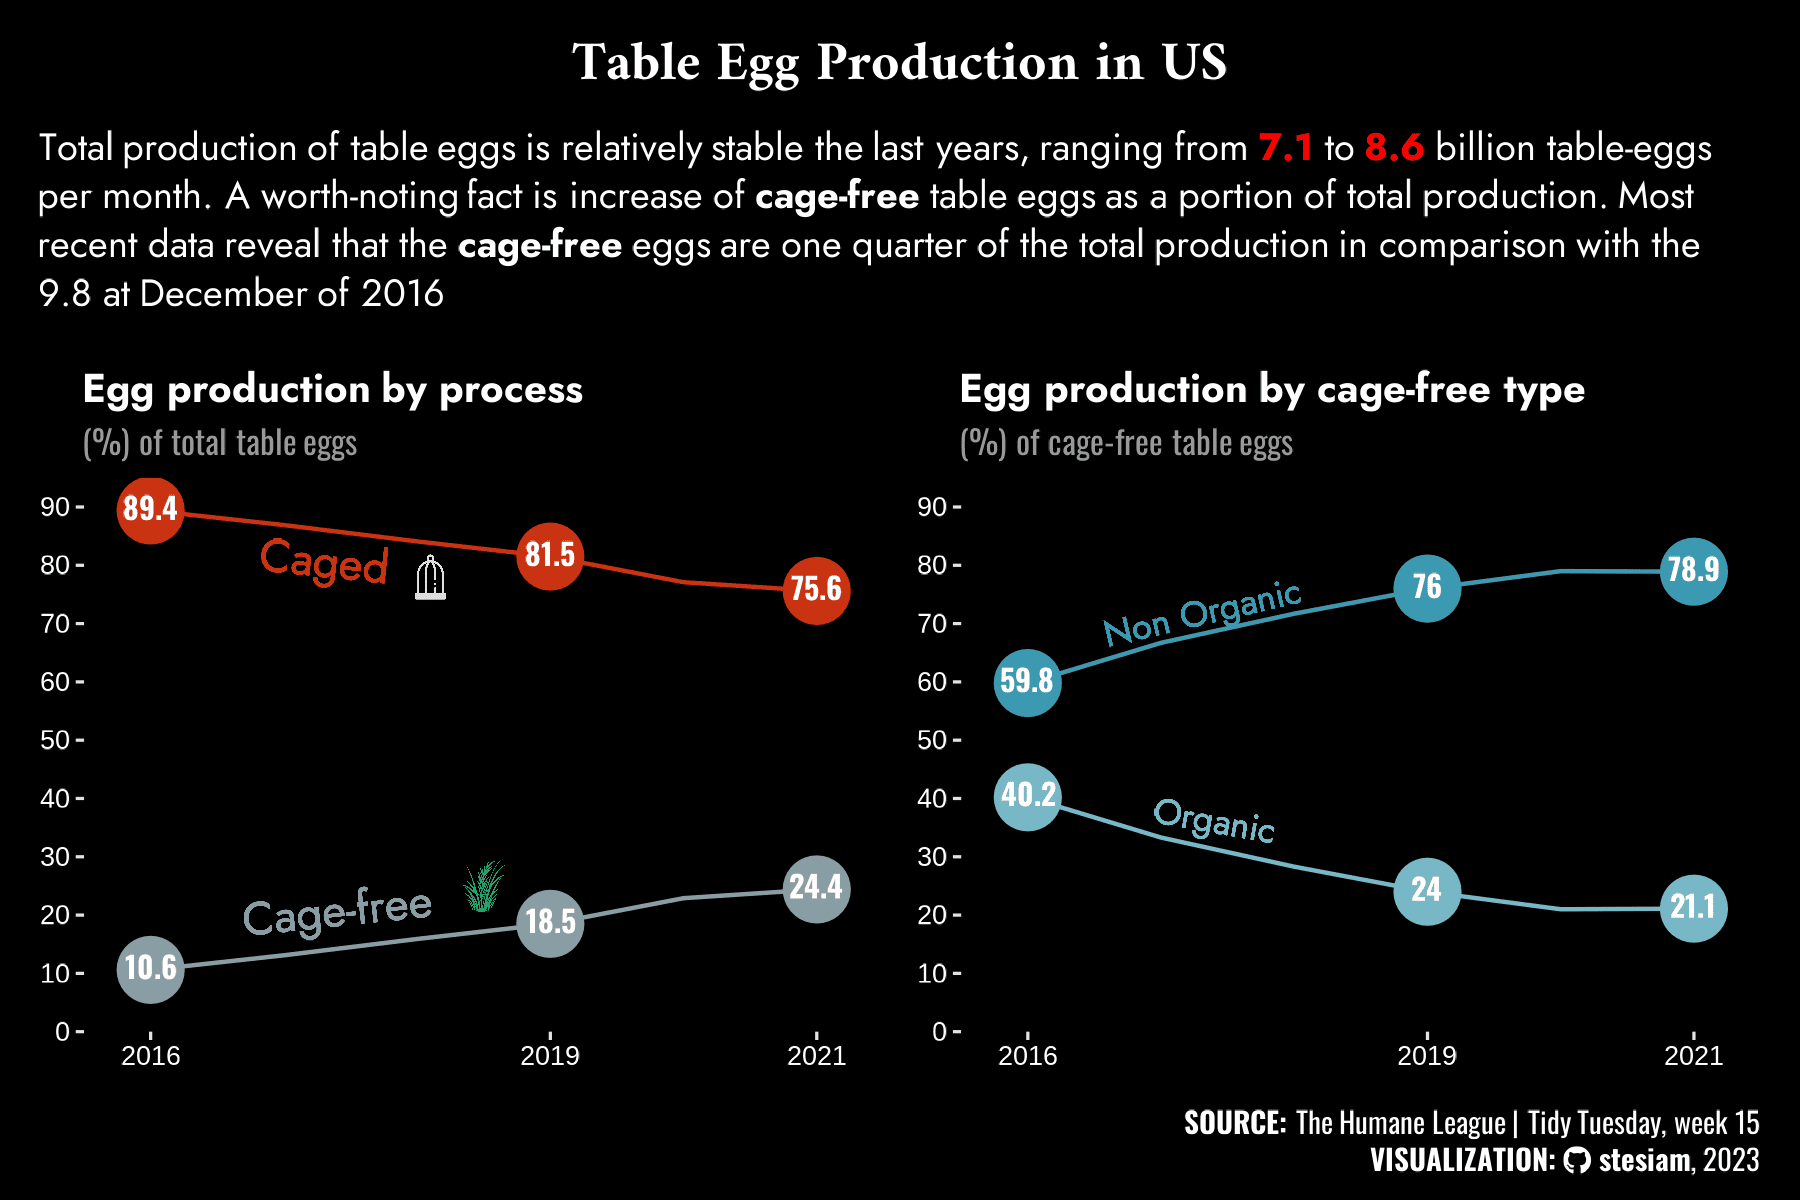
Week 15, 2023

Week 17, 2023

Week 41, 2023
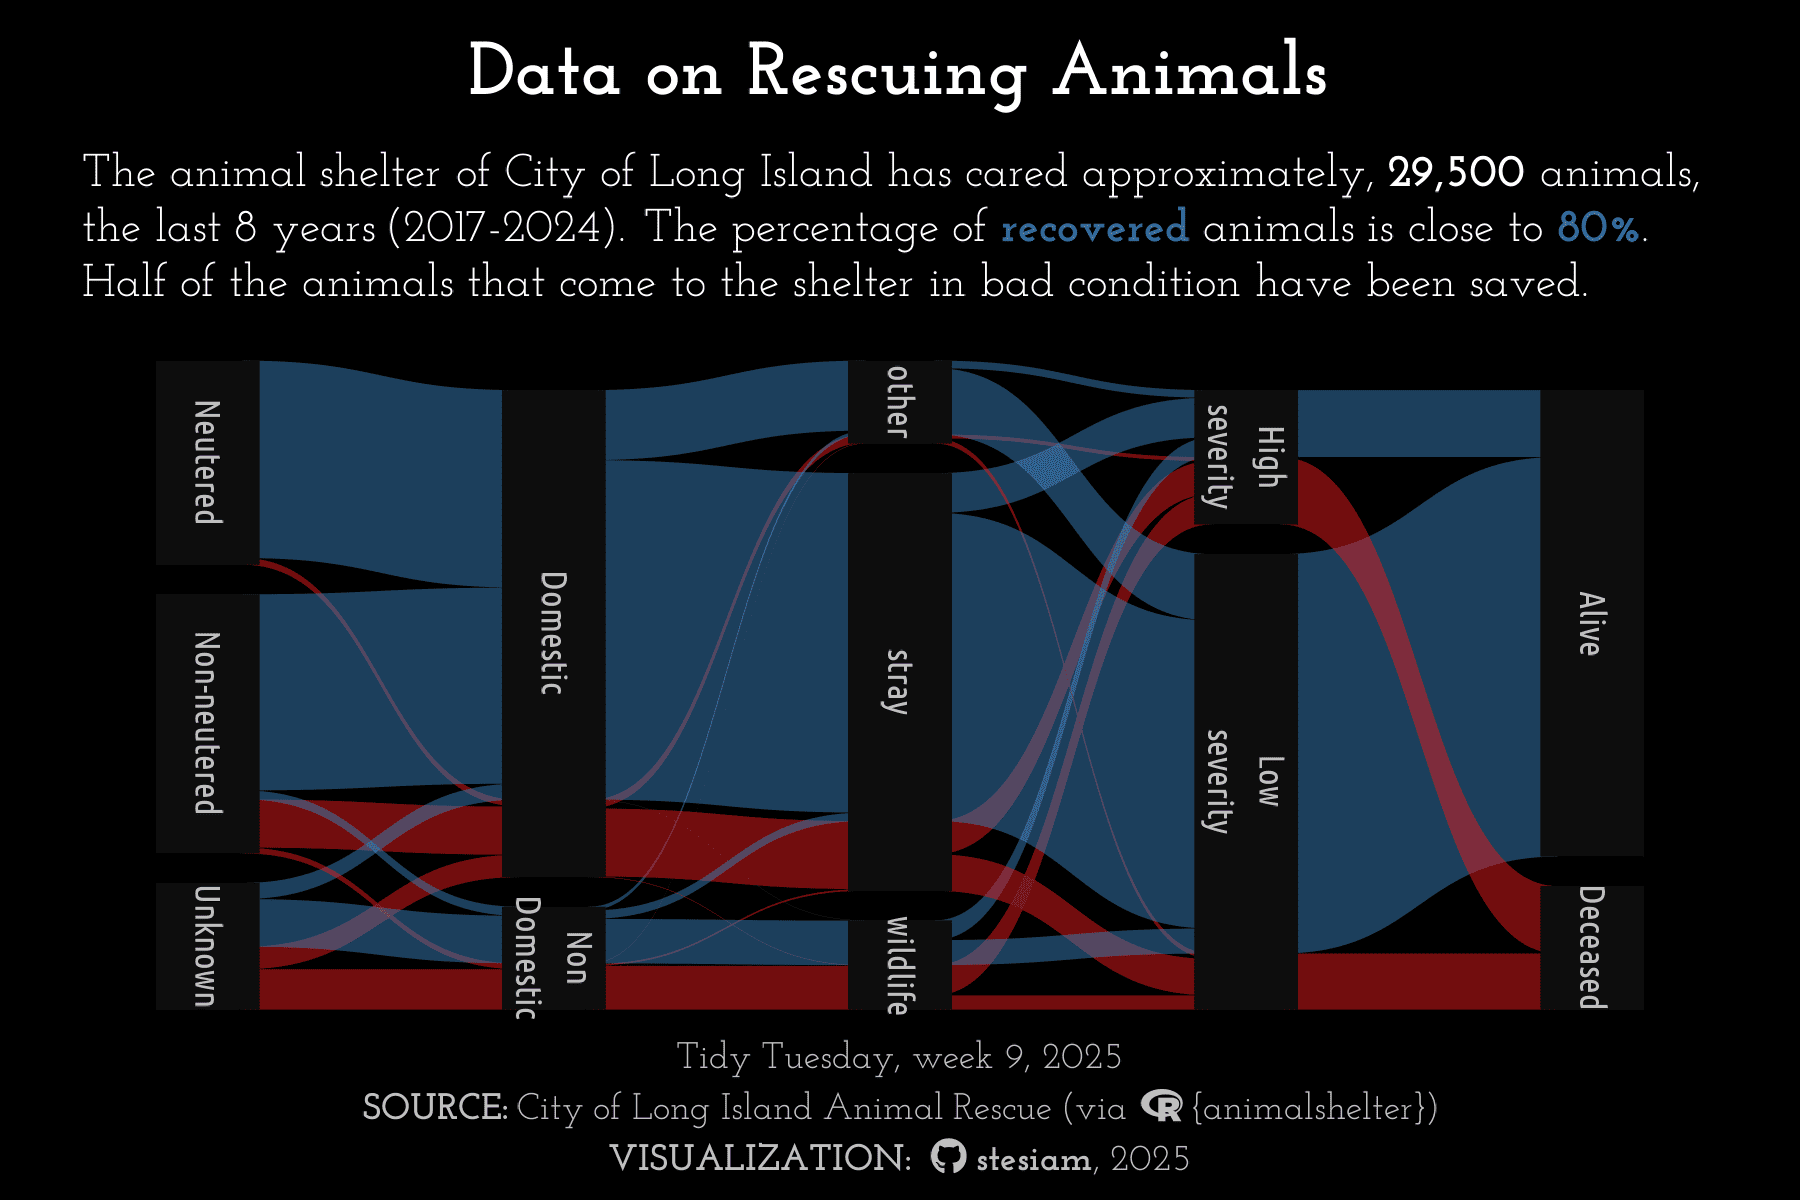
Week 9, 2025
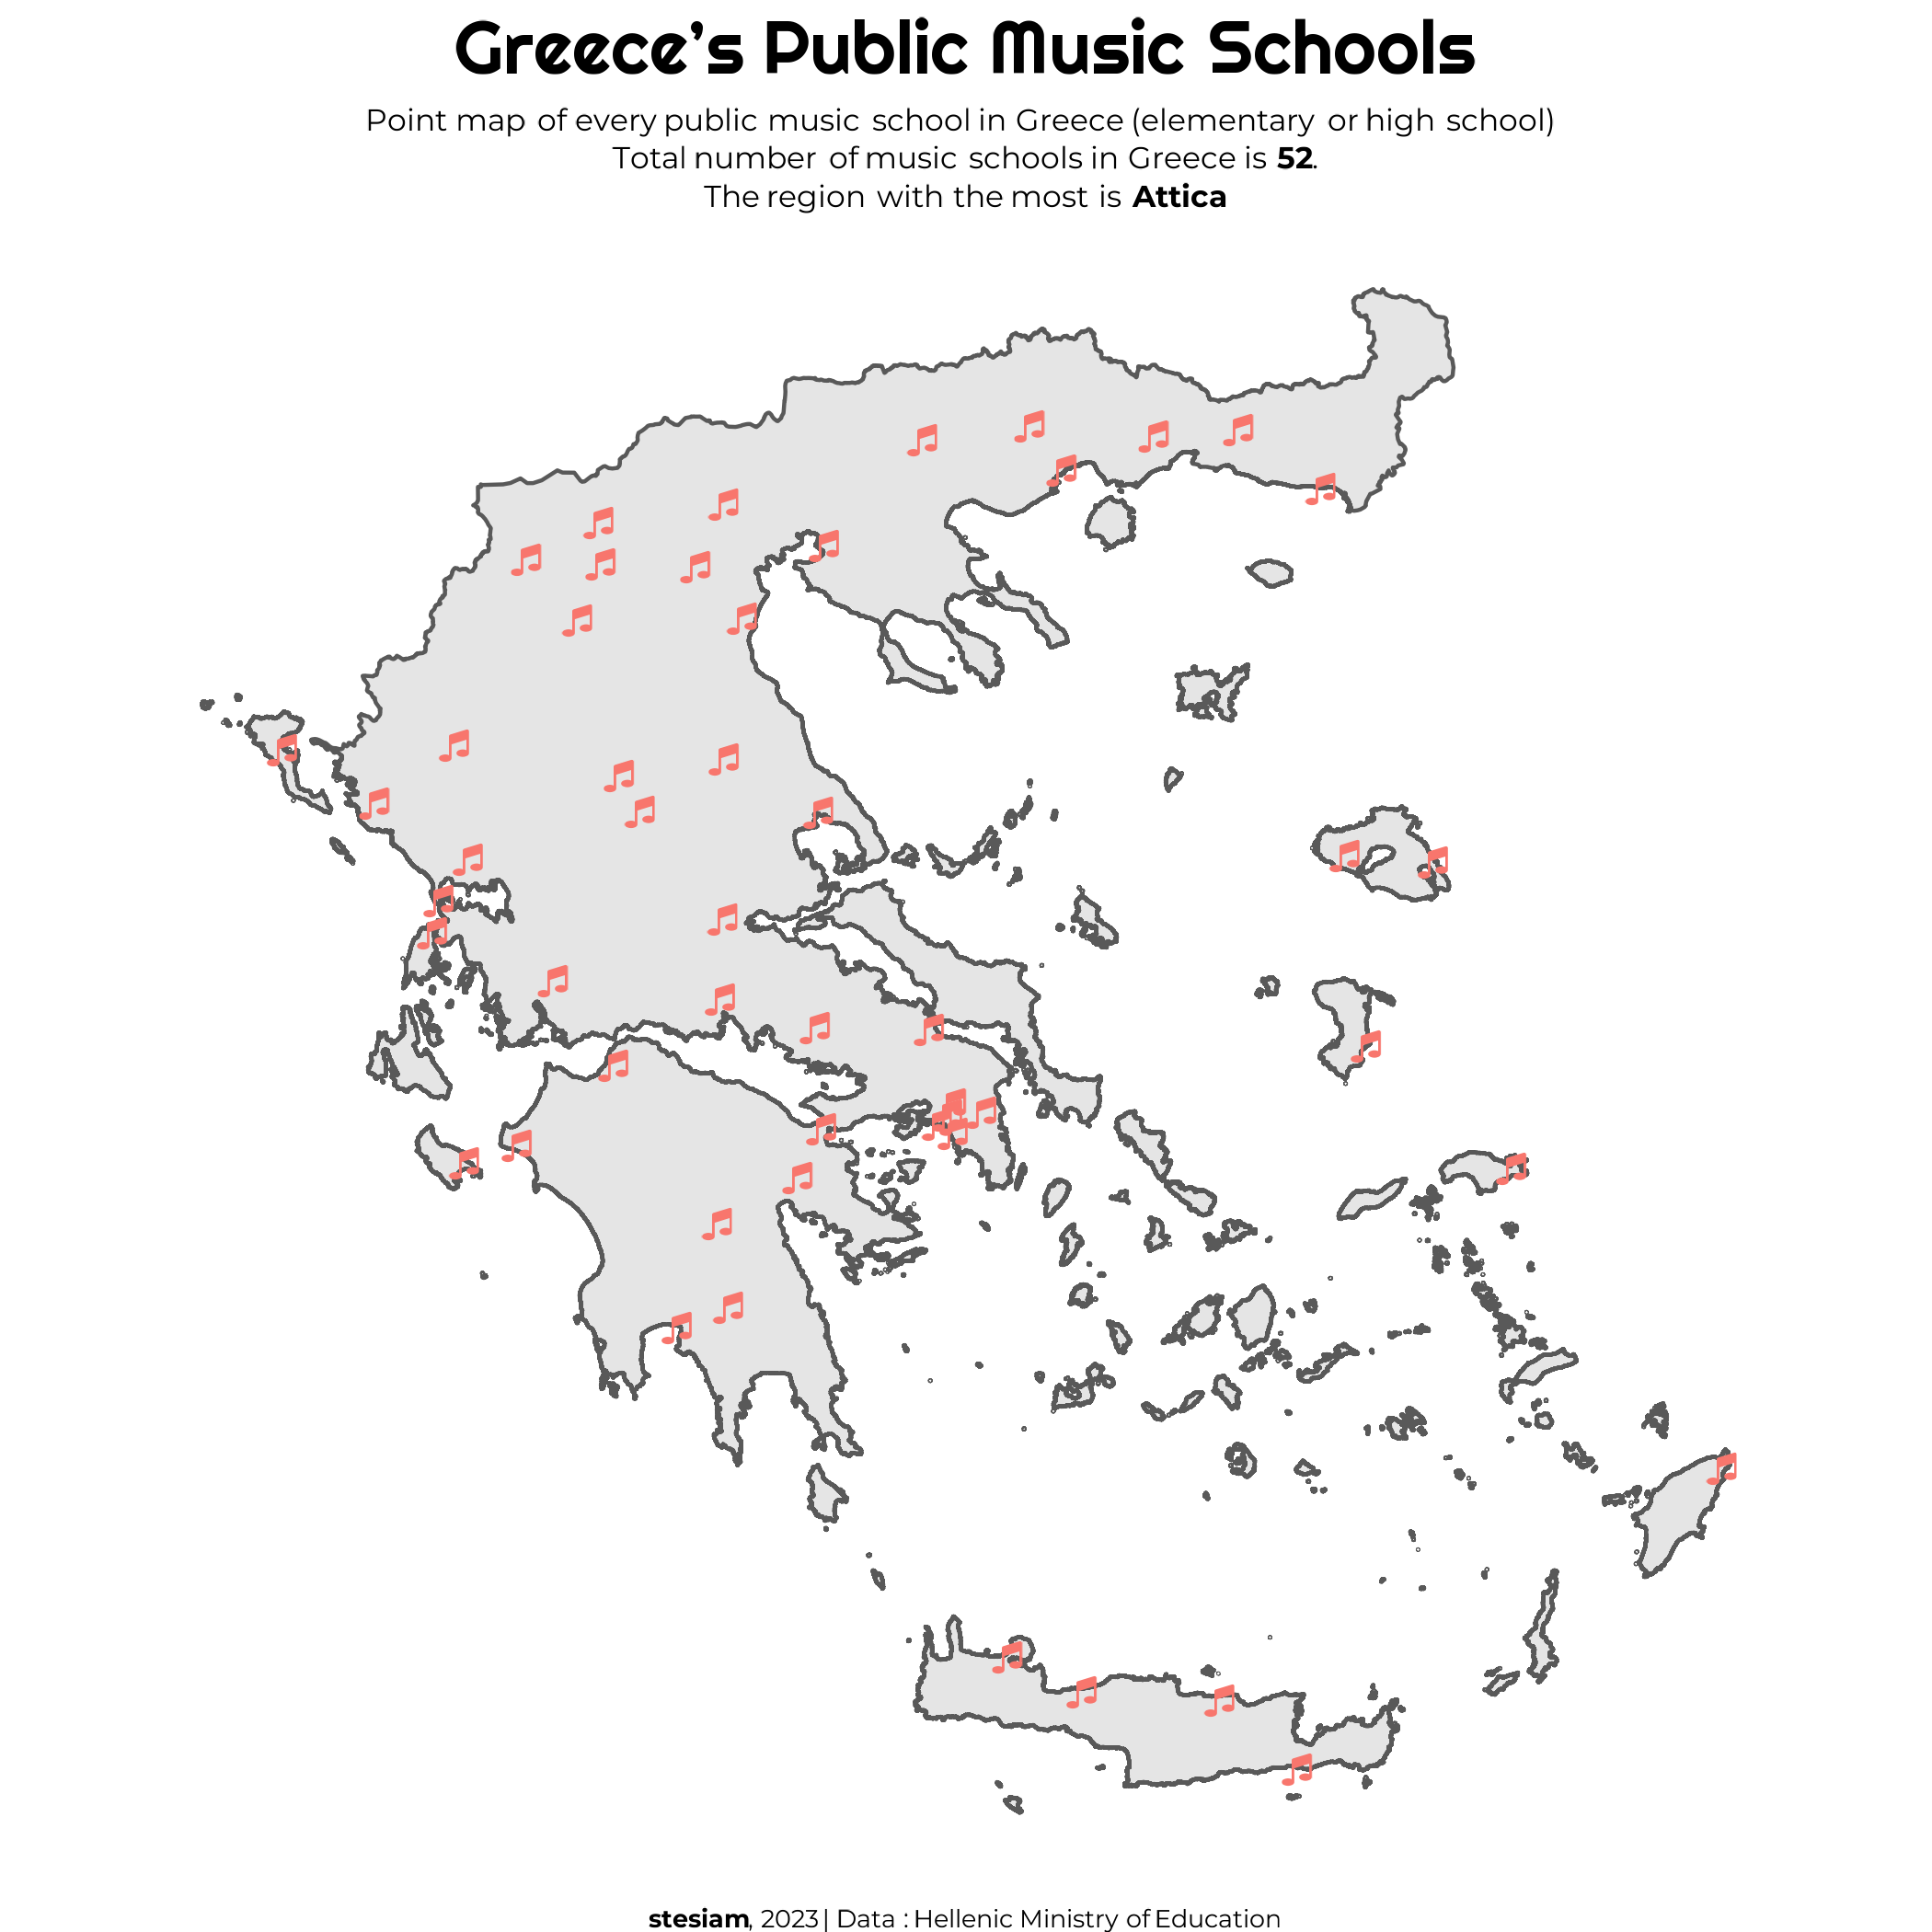
Public Music Schools
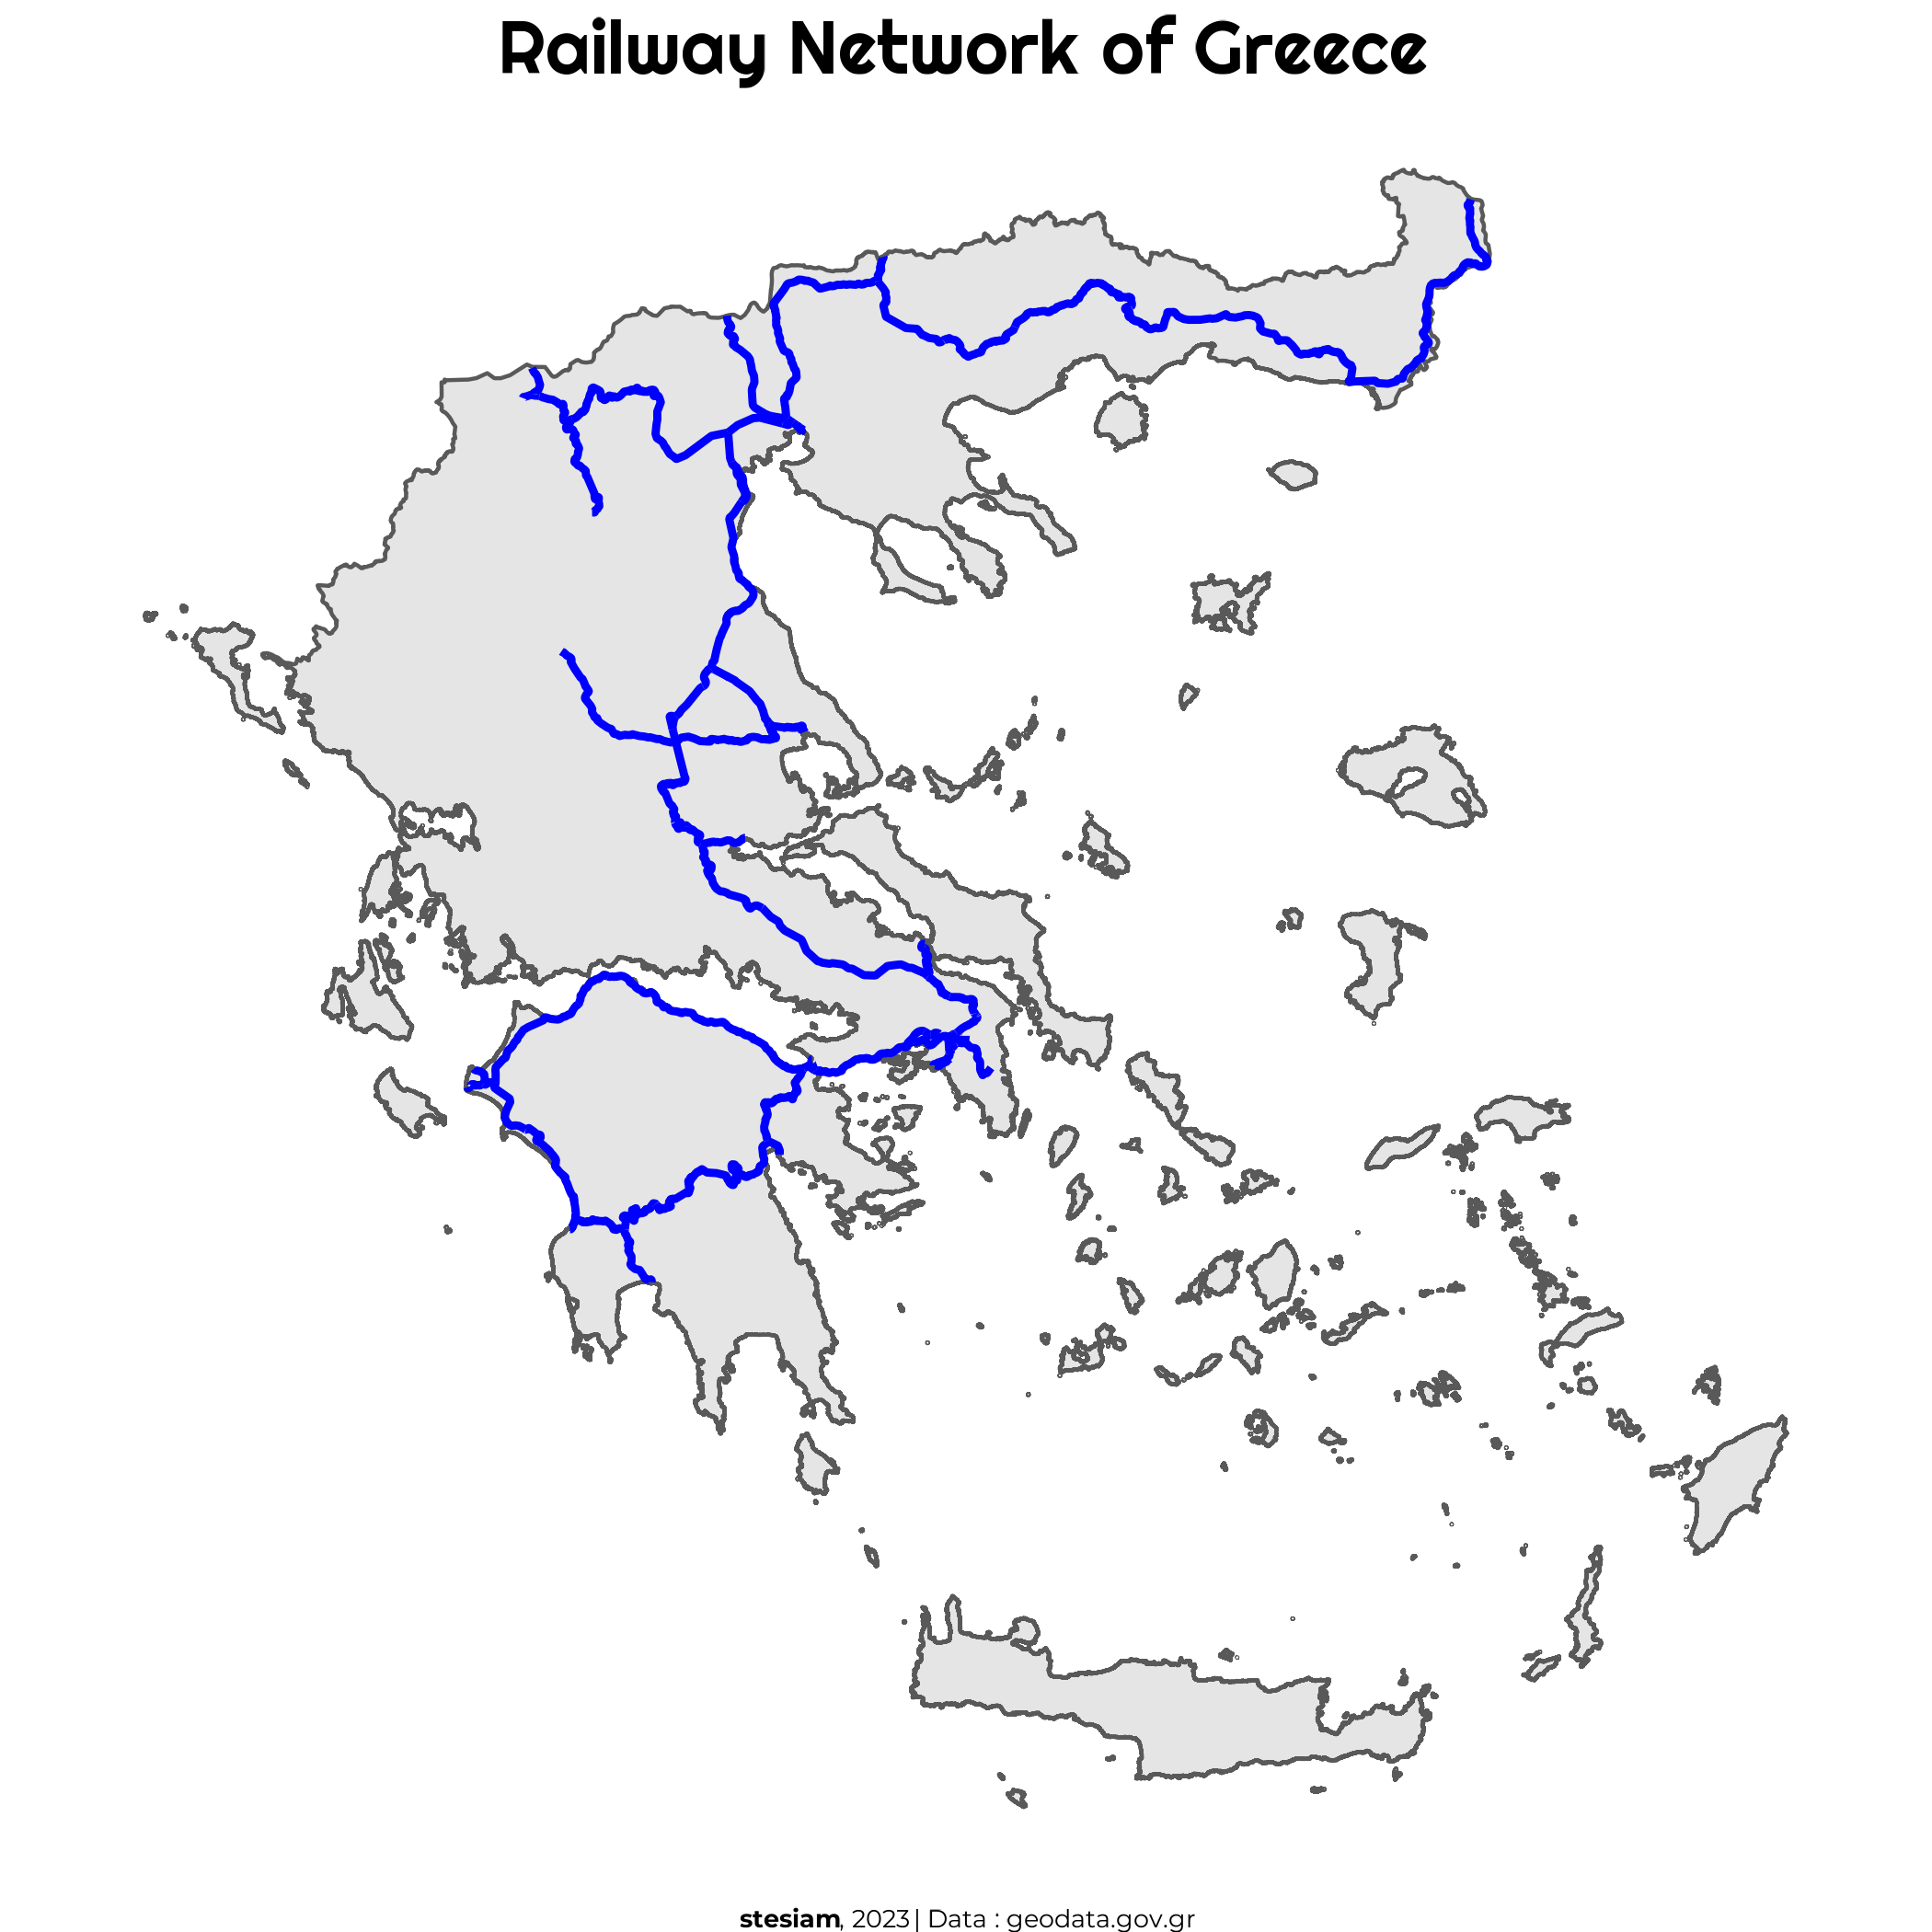
Railway Network
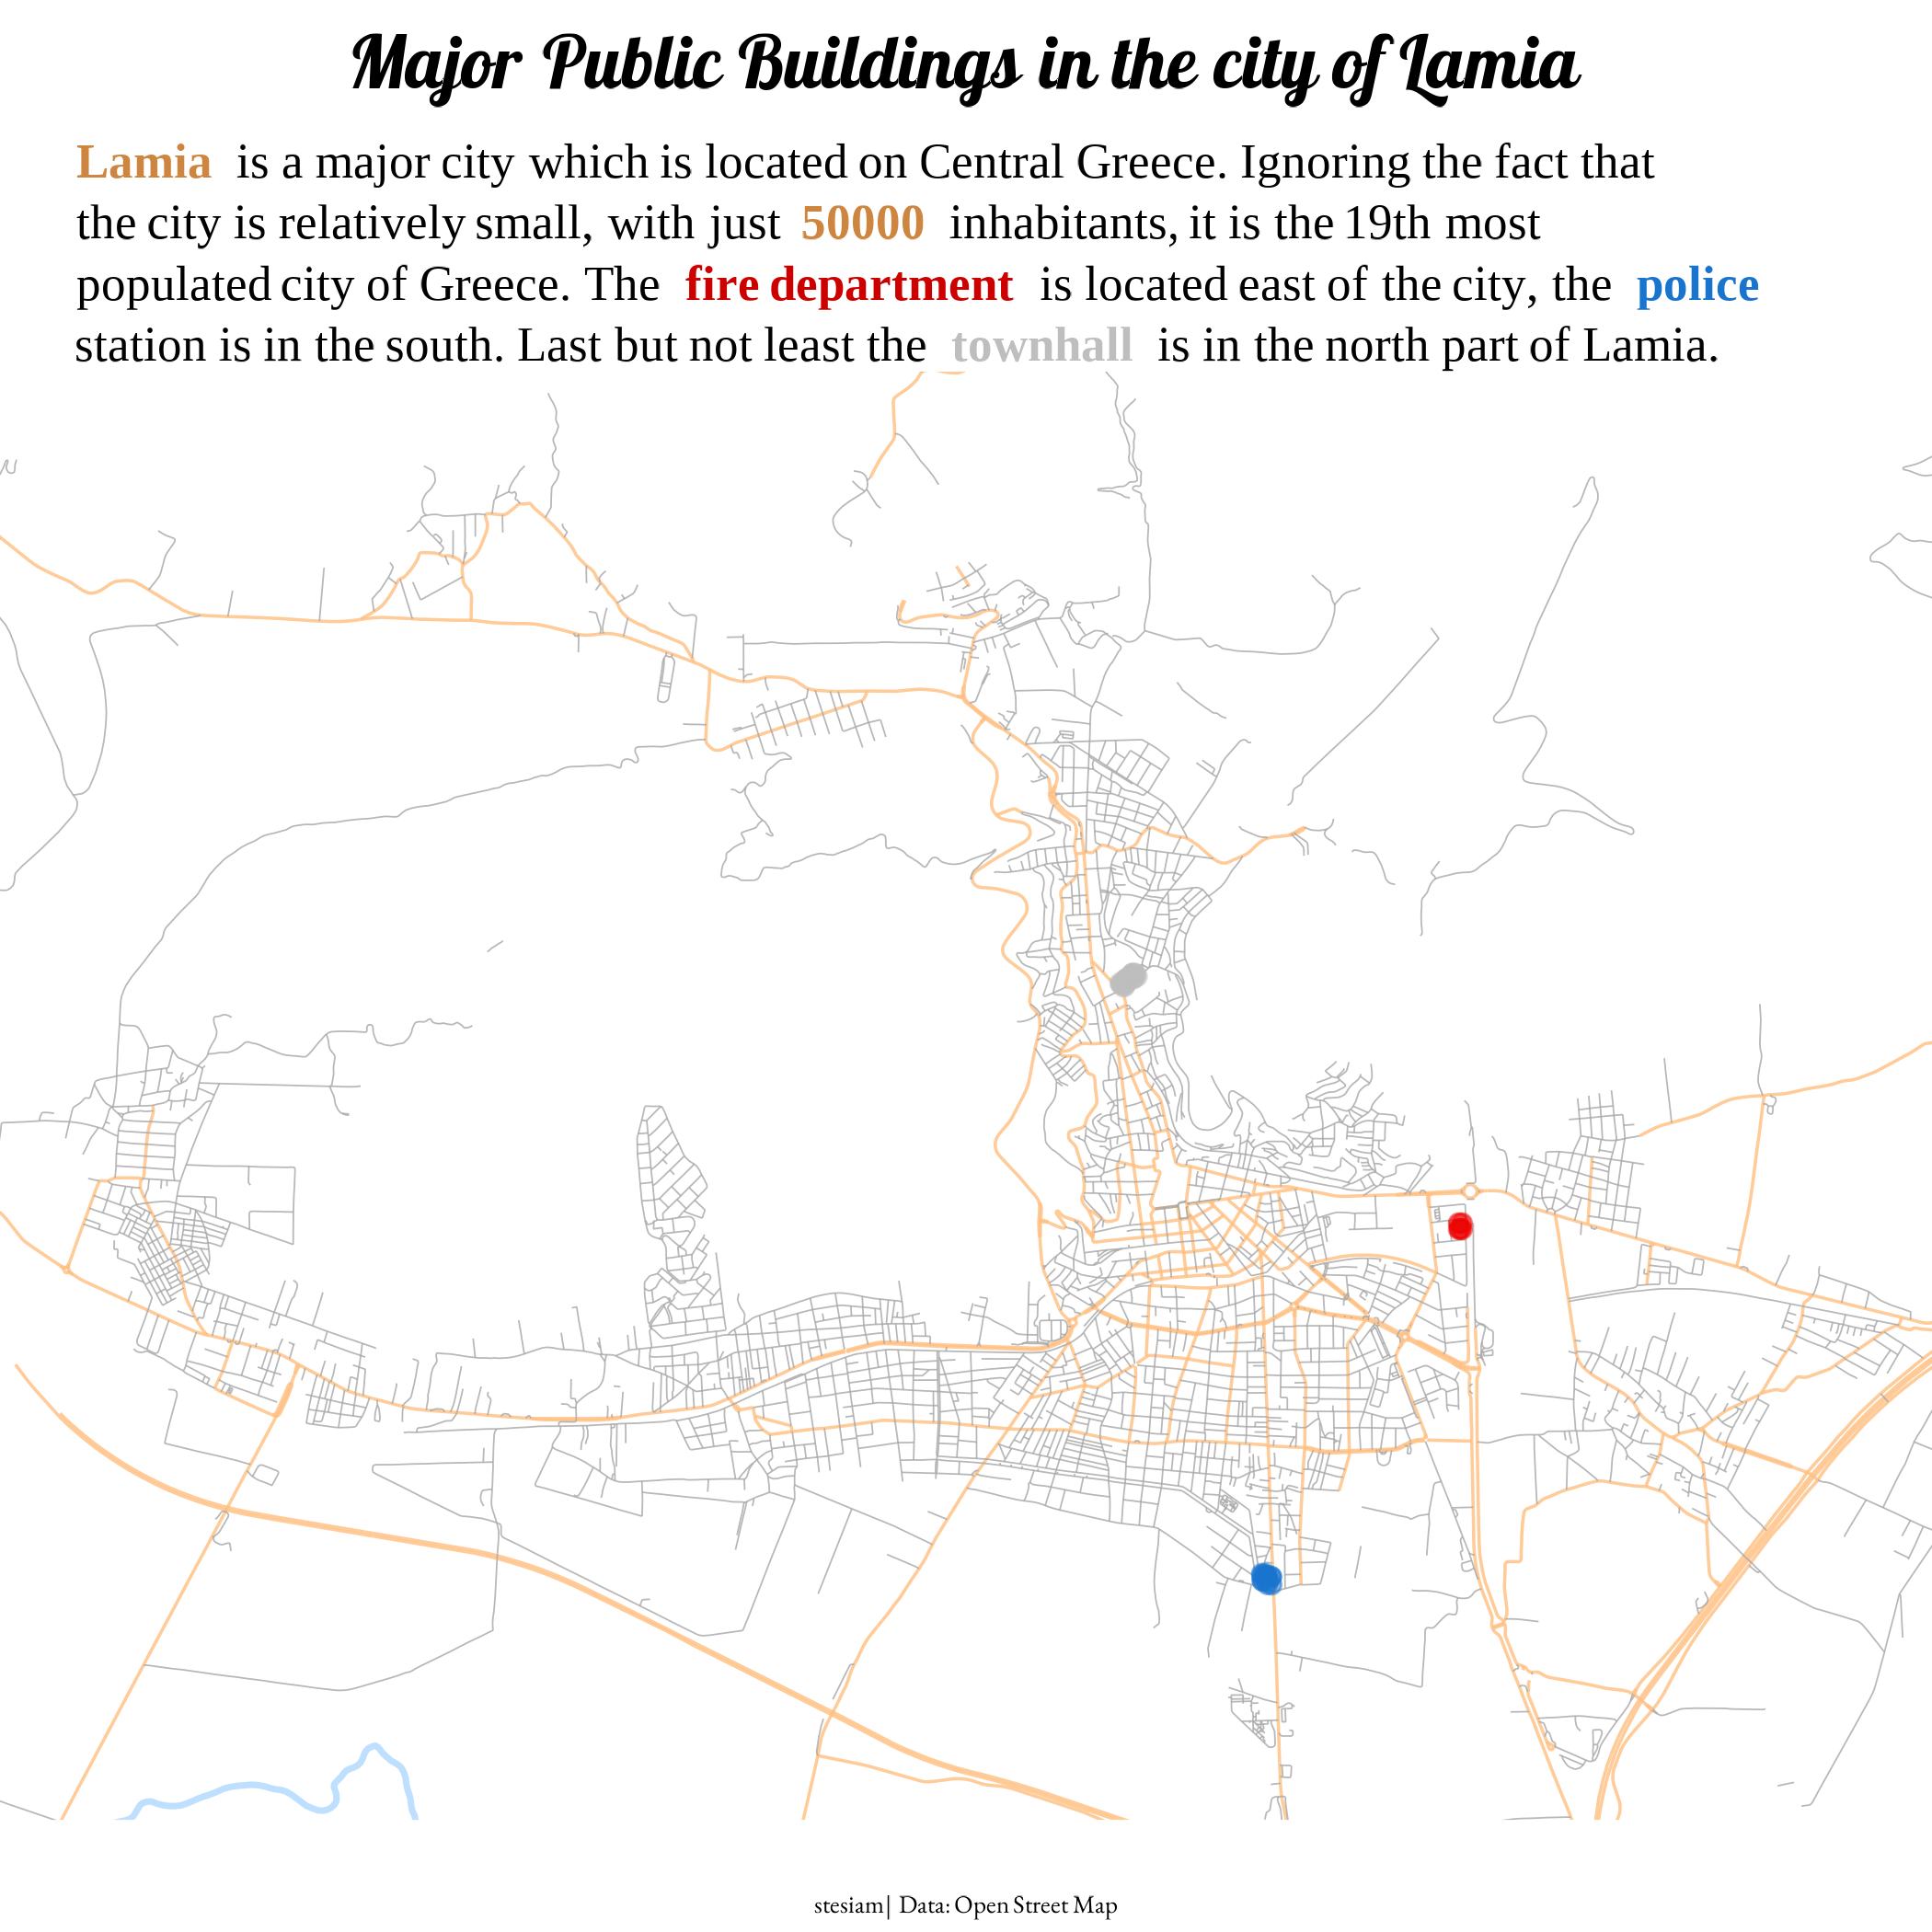
Public Buildings, Lamia
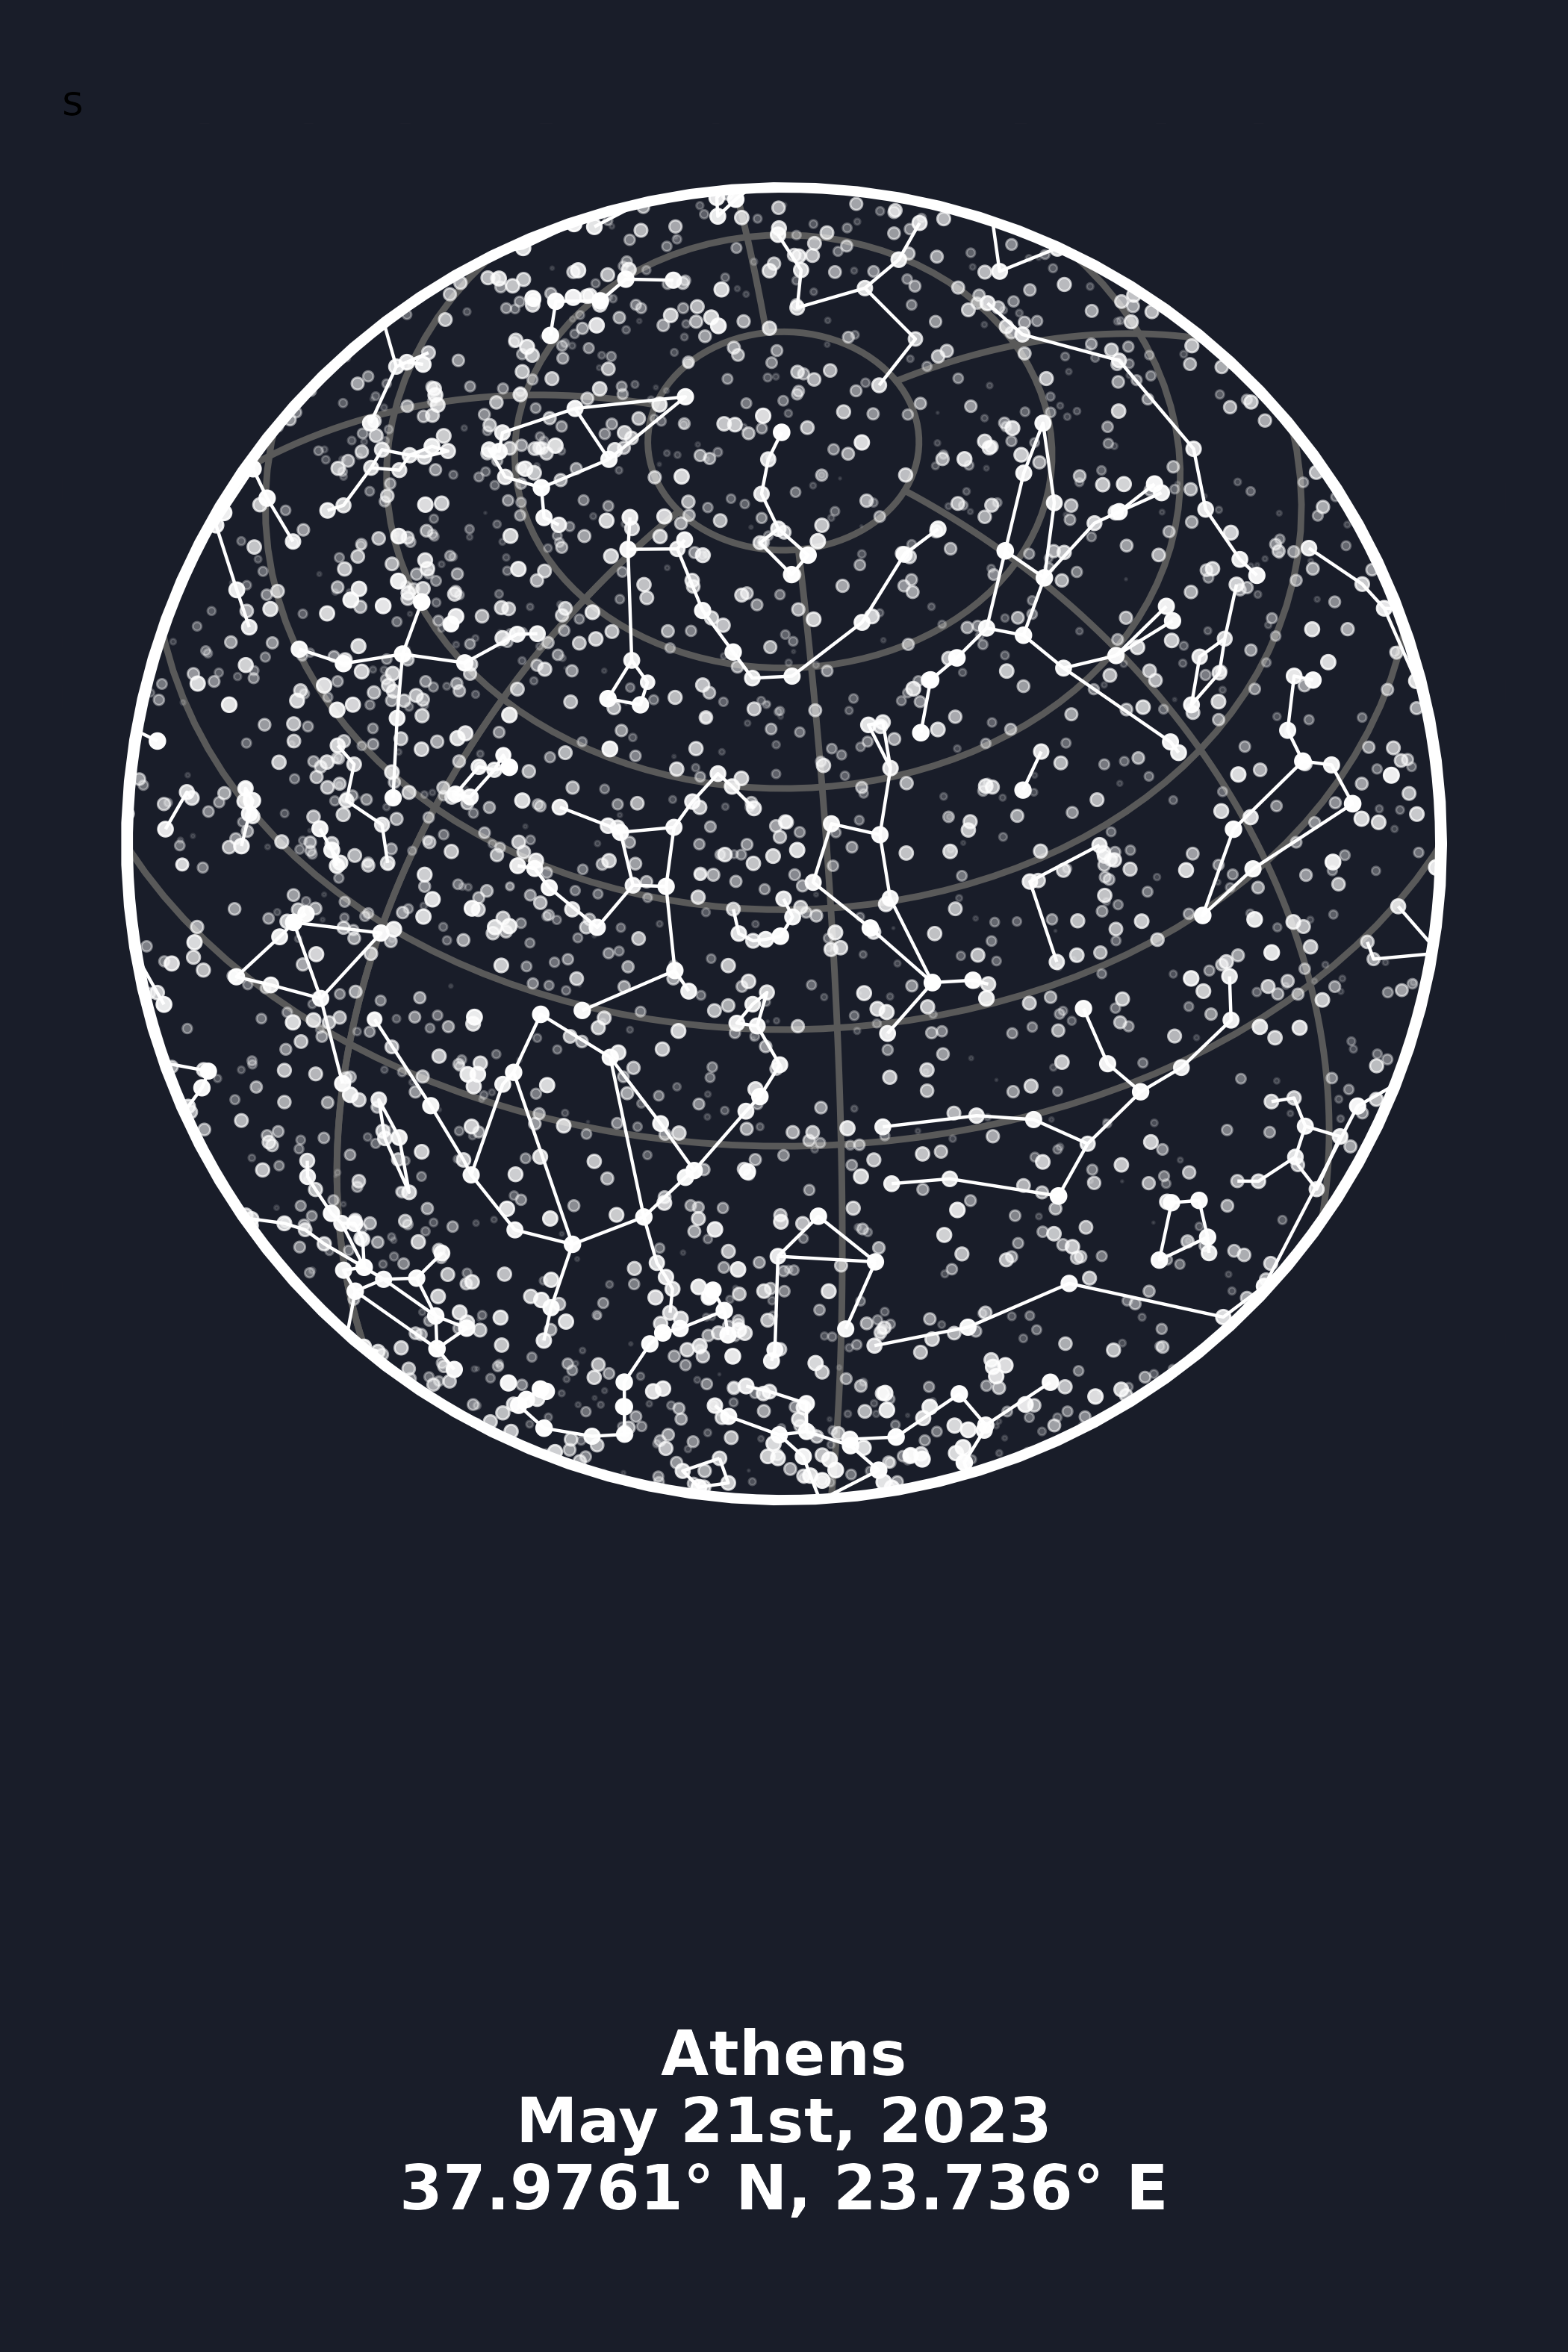
Starmap of Athens
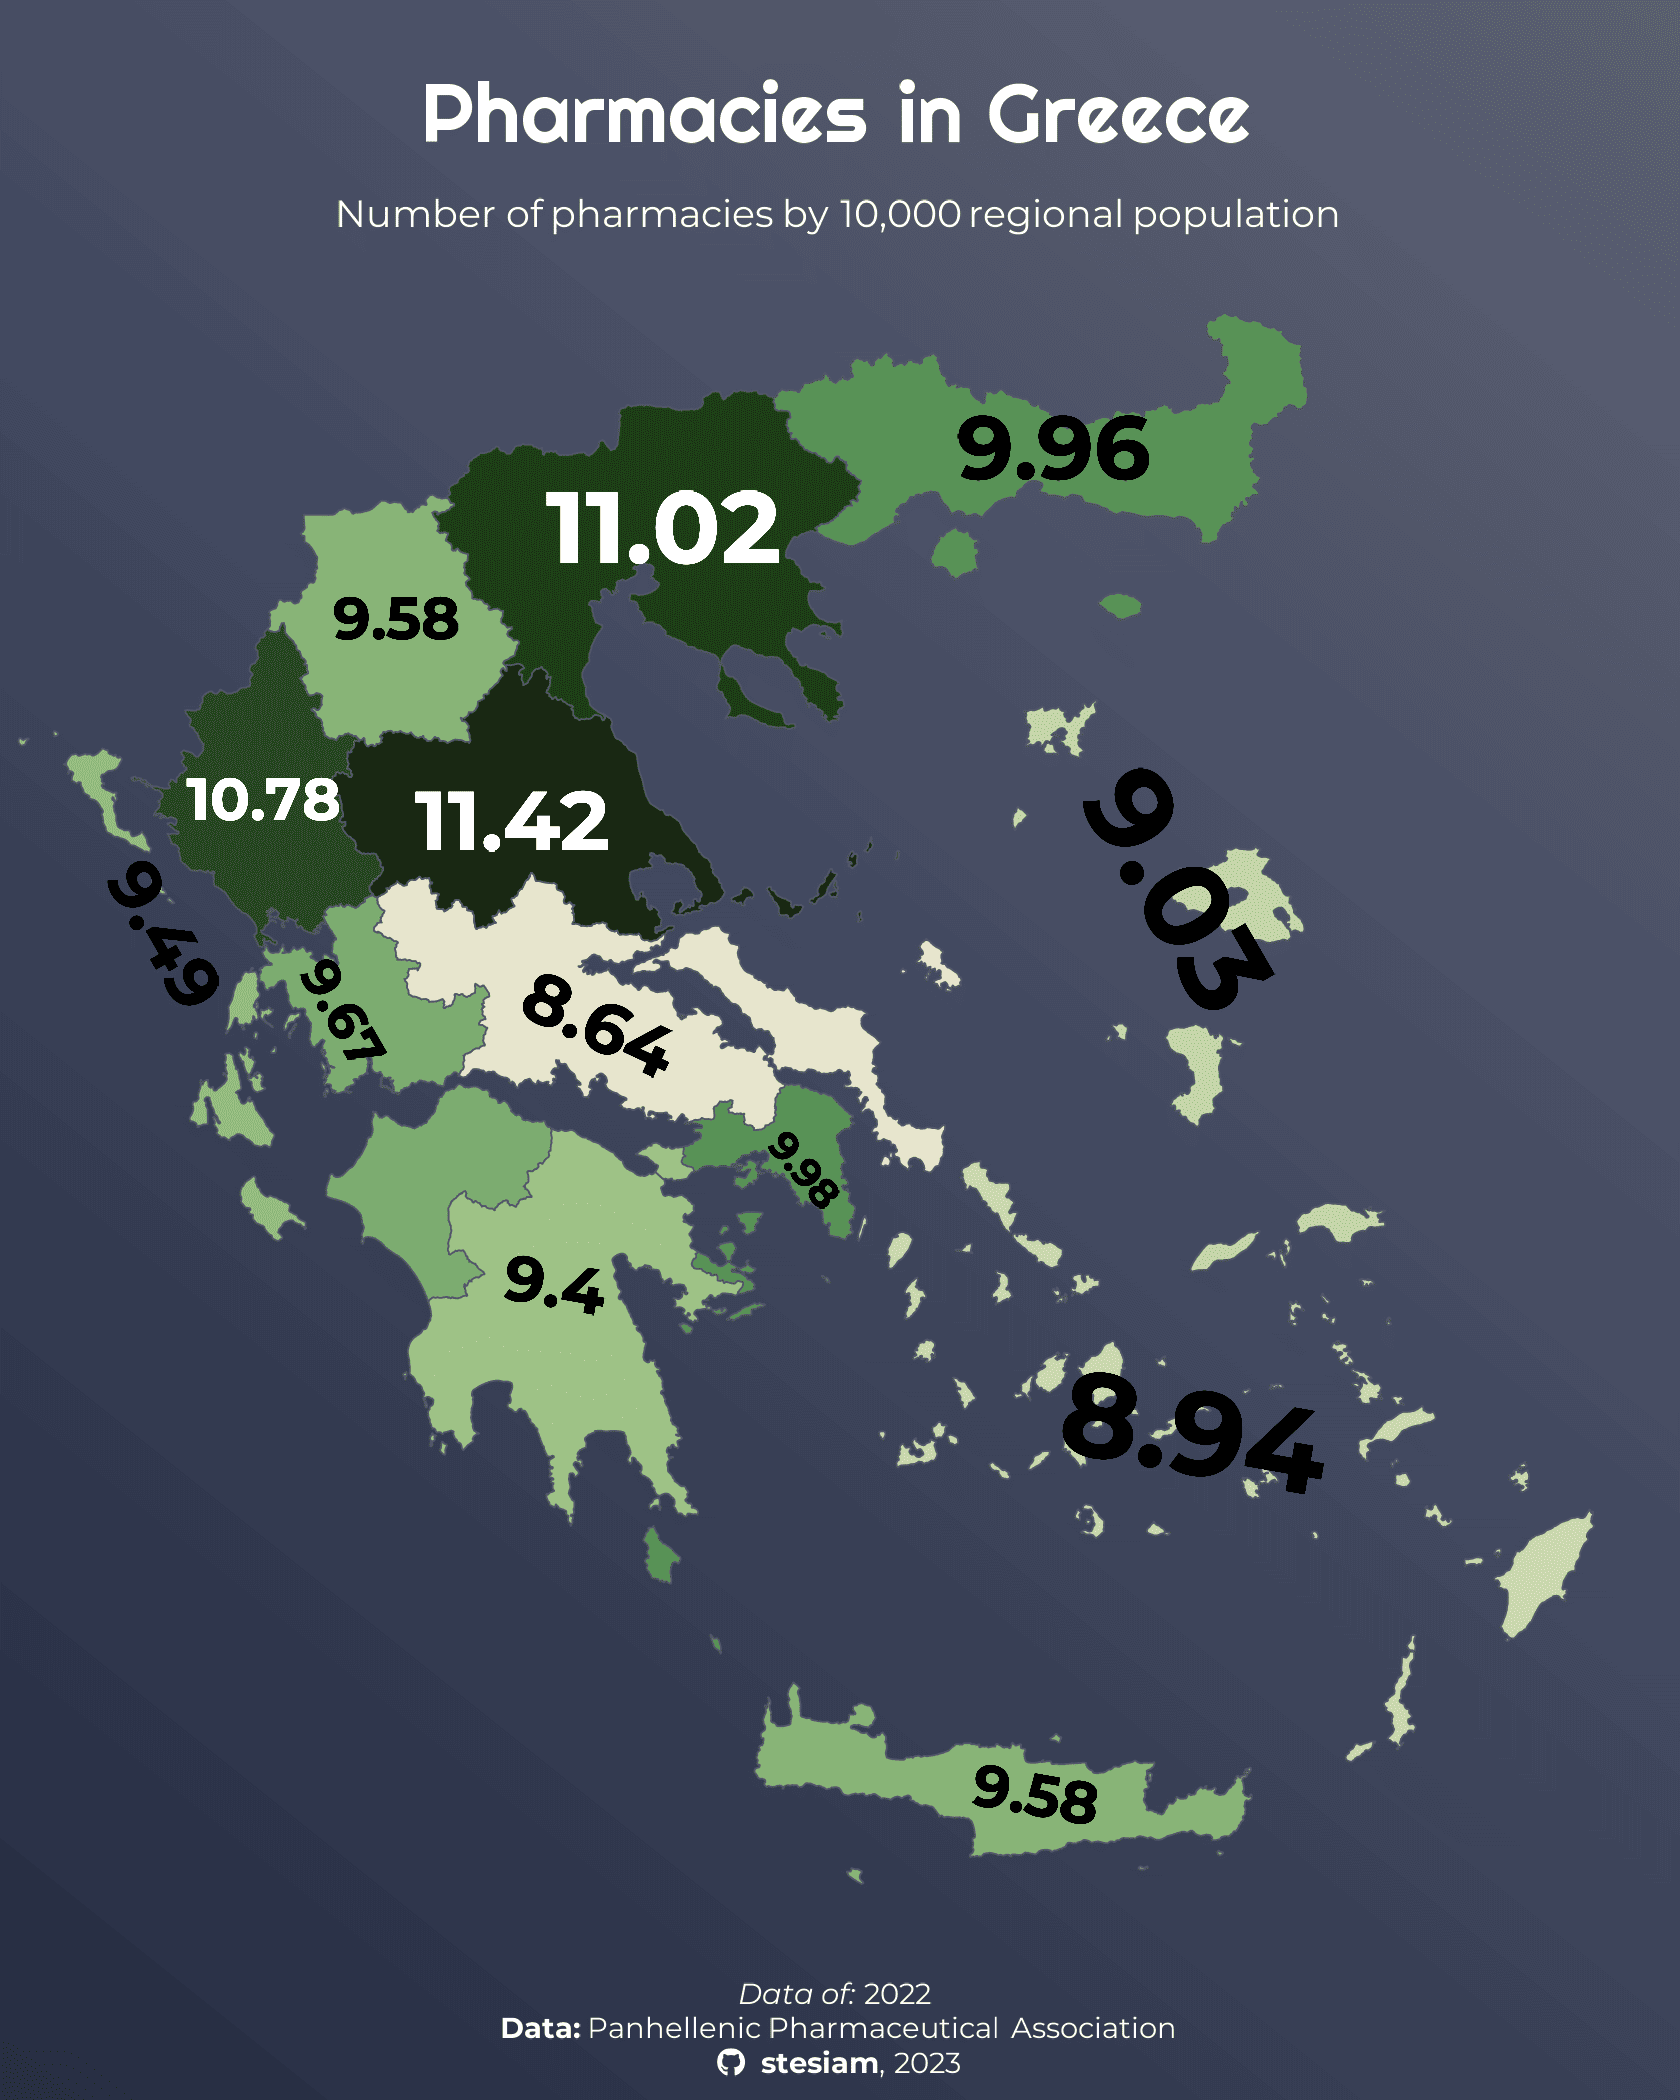
Pharmacies in Greece
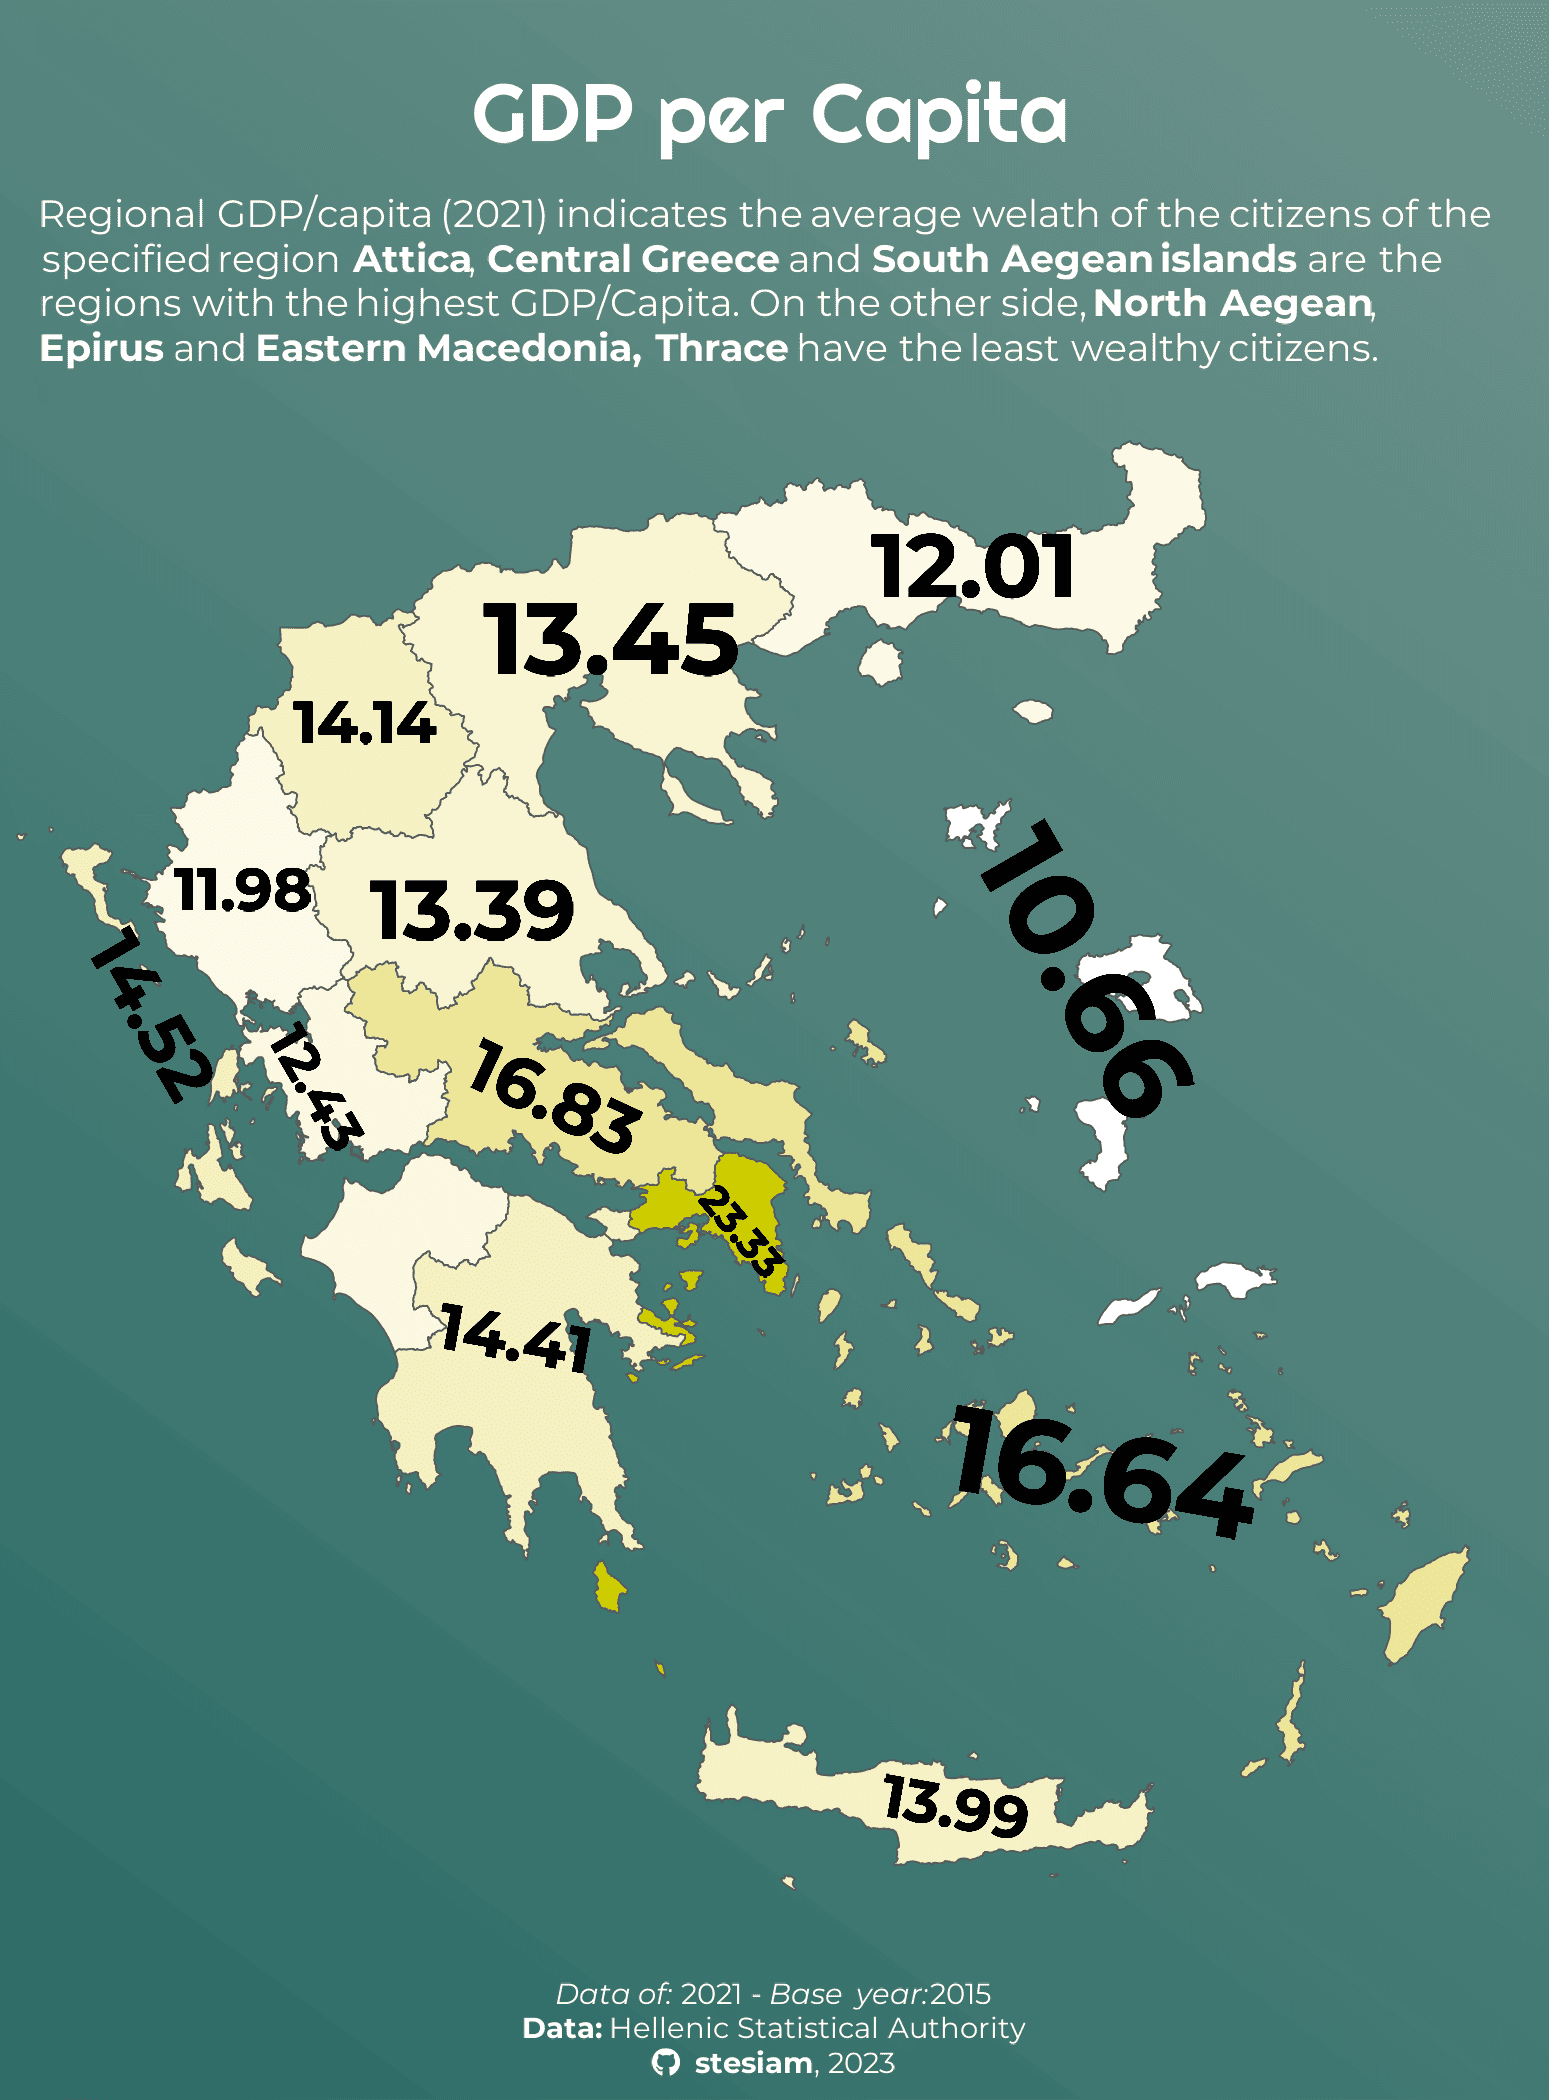
GDP per Capita
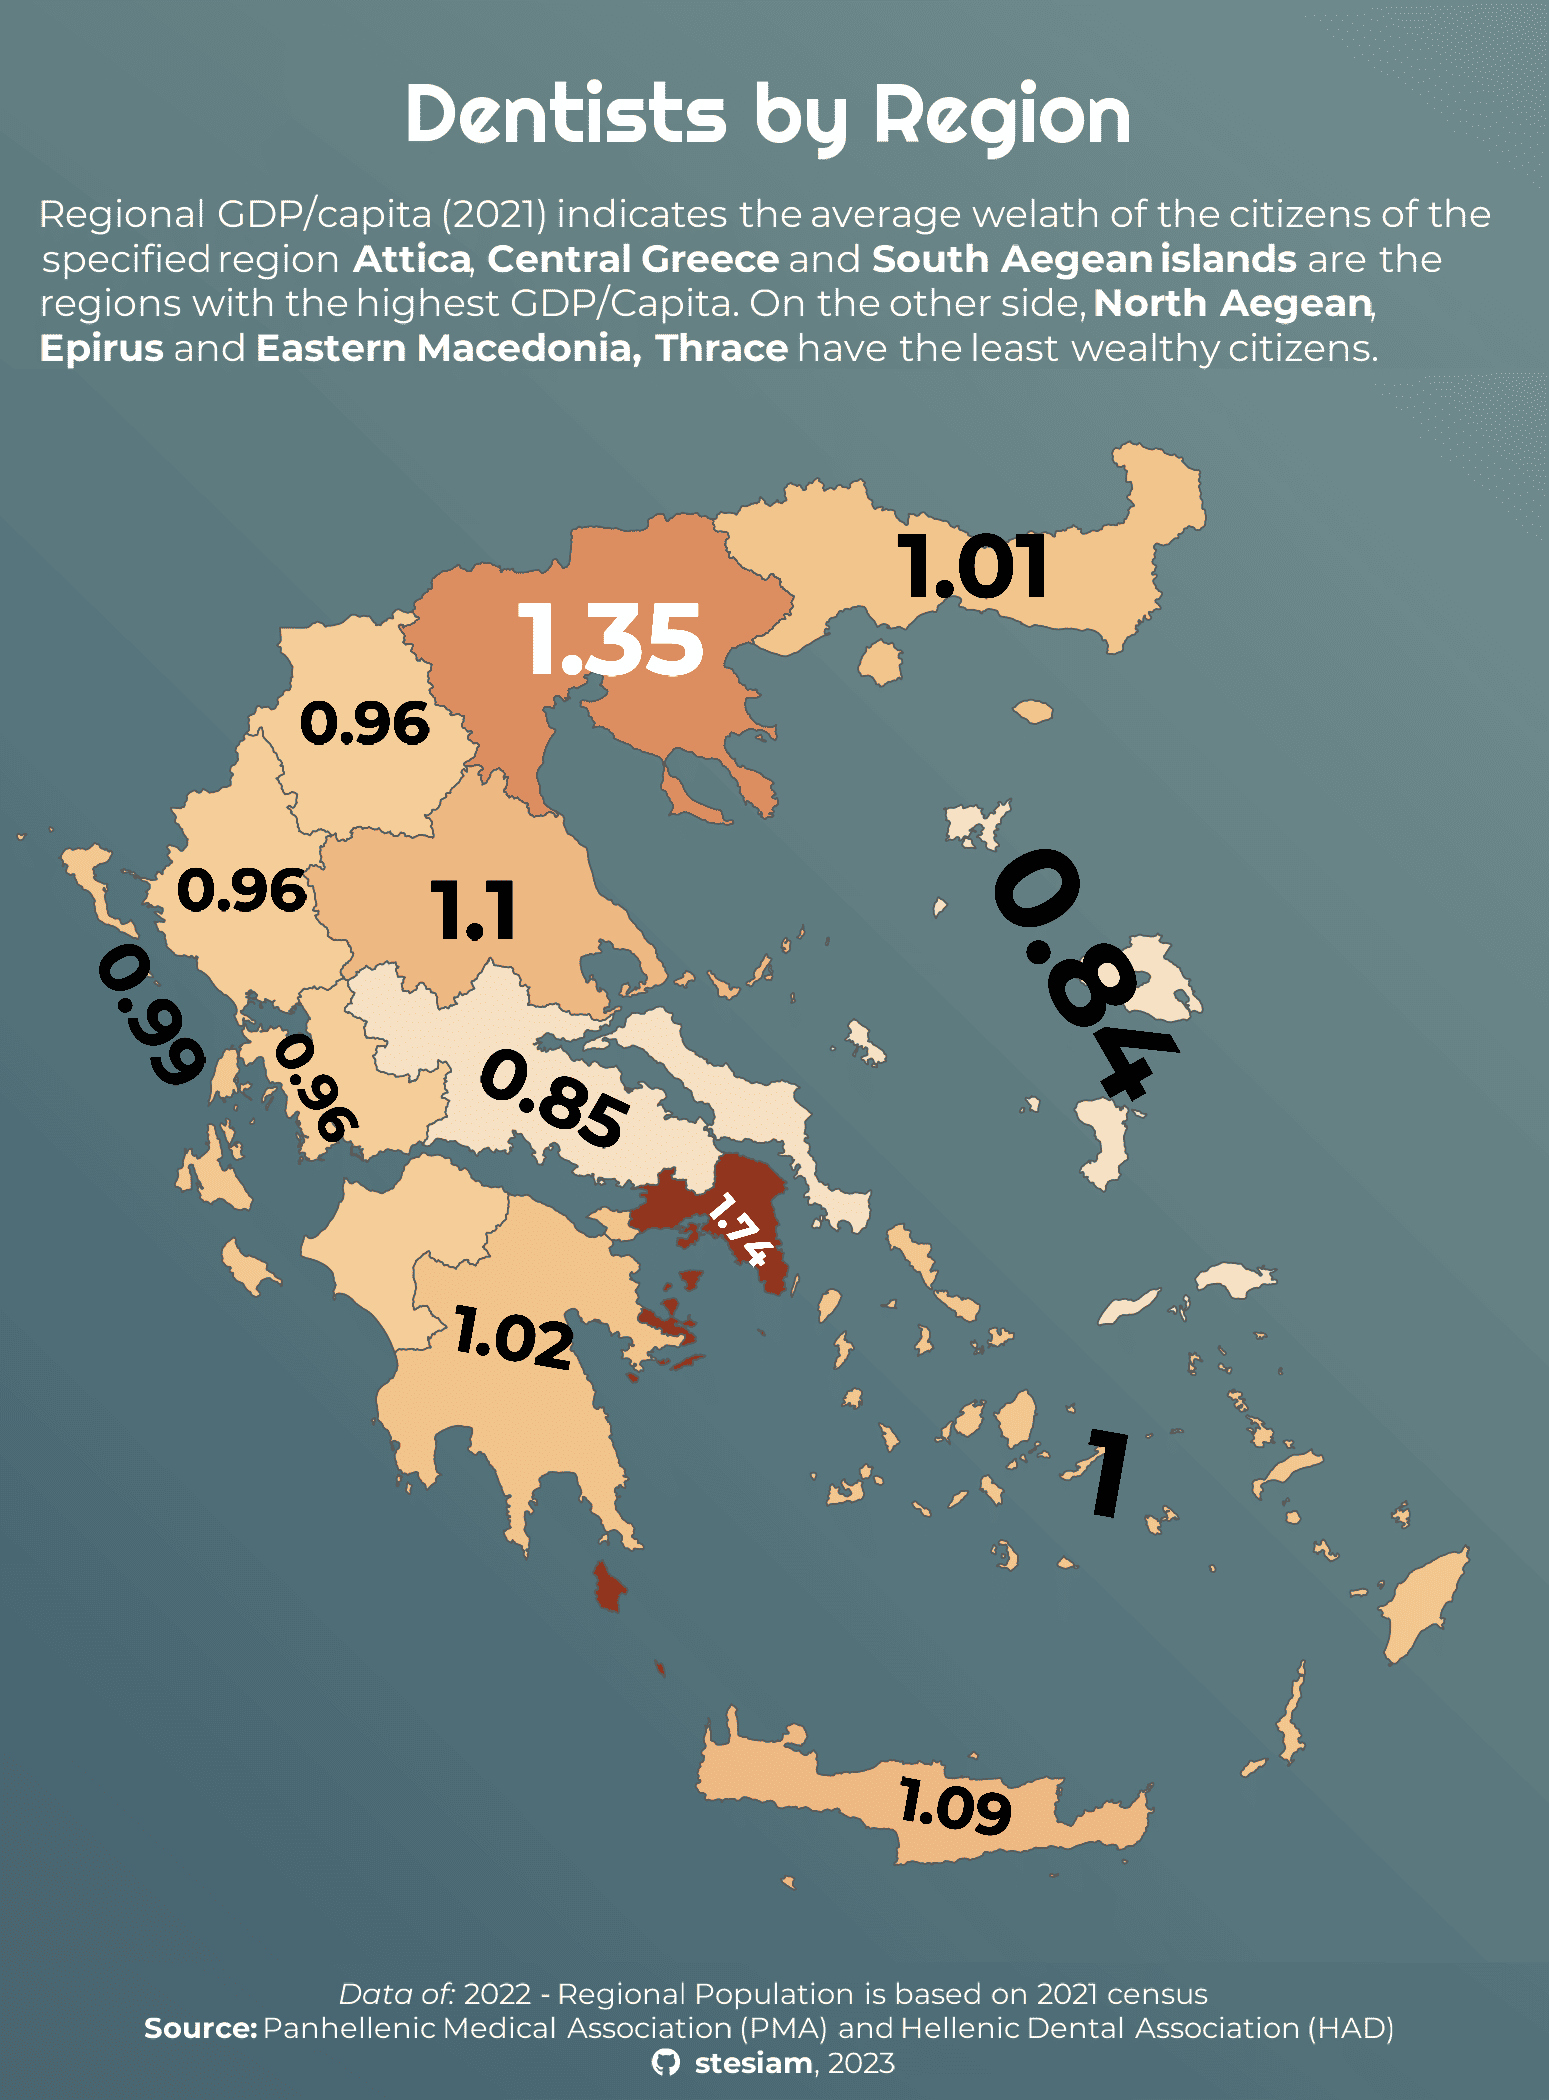
Dentists per Region
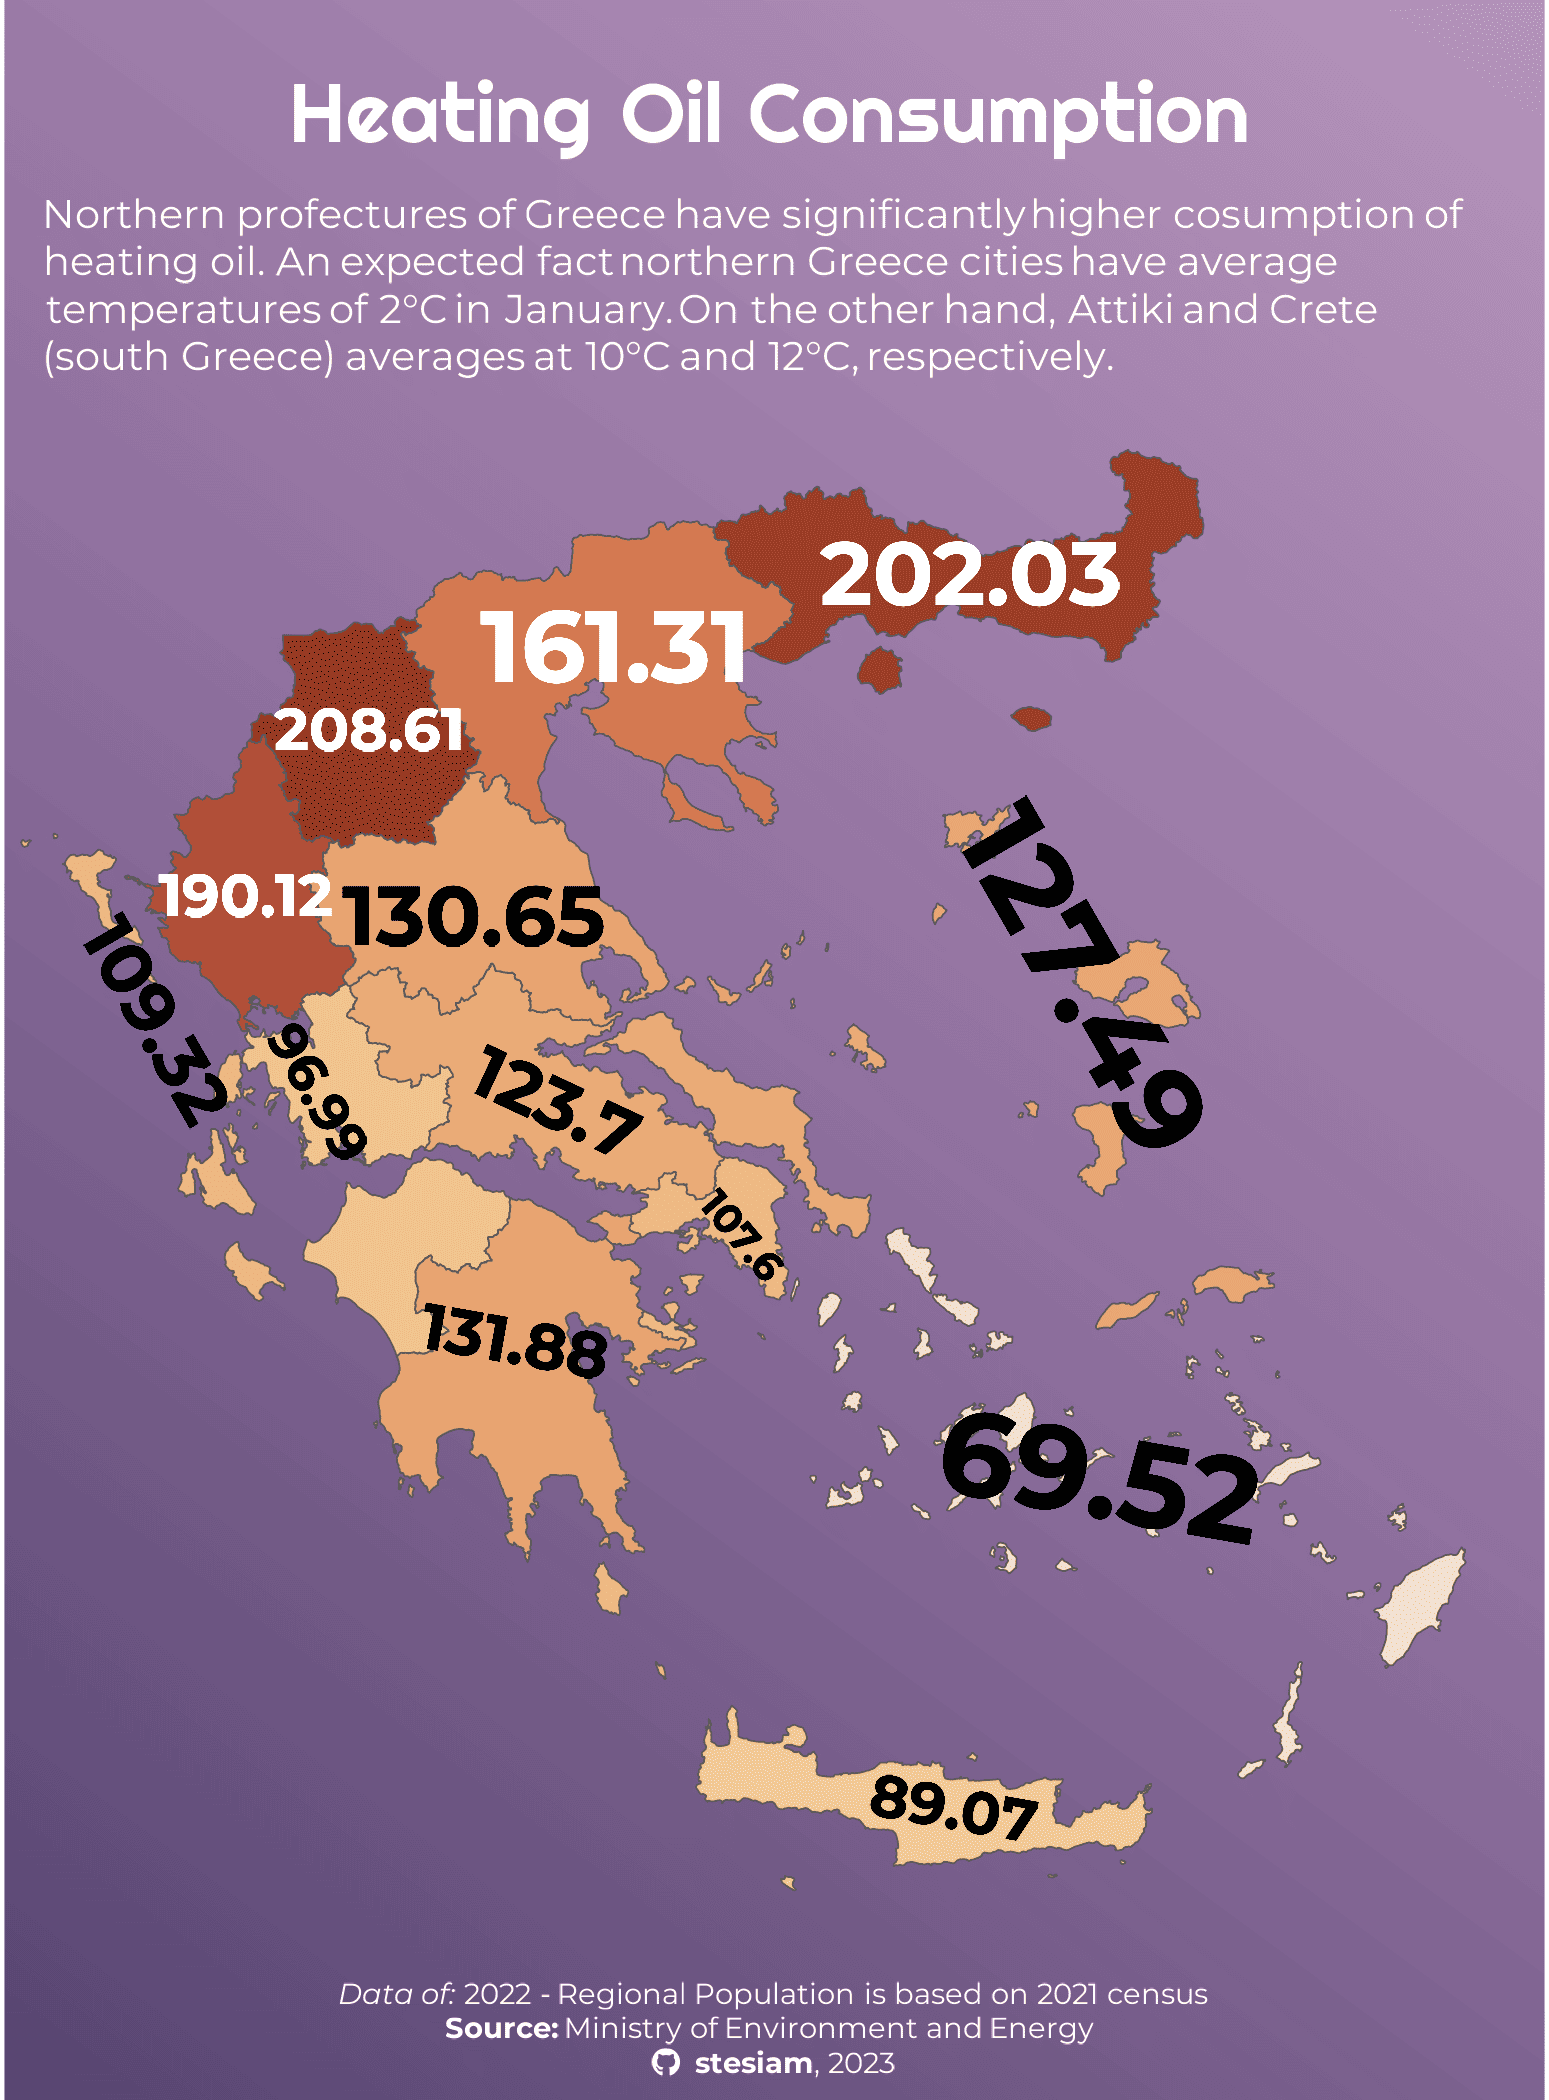
Heating Oil Consumption
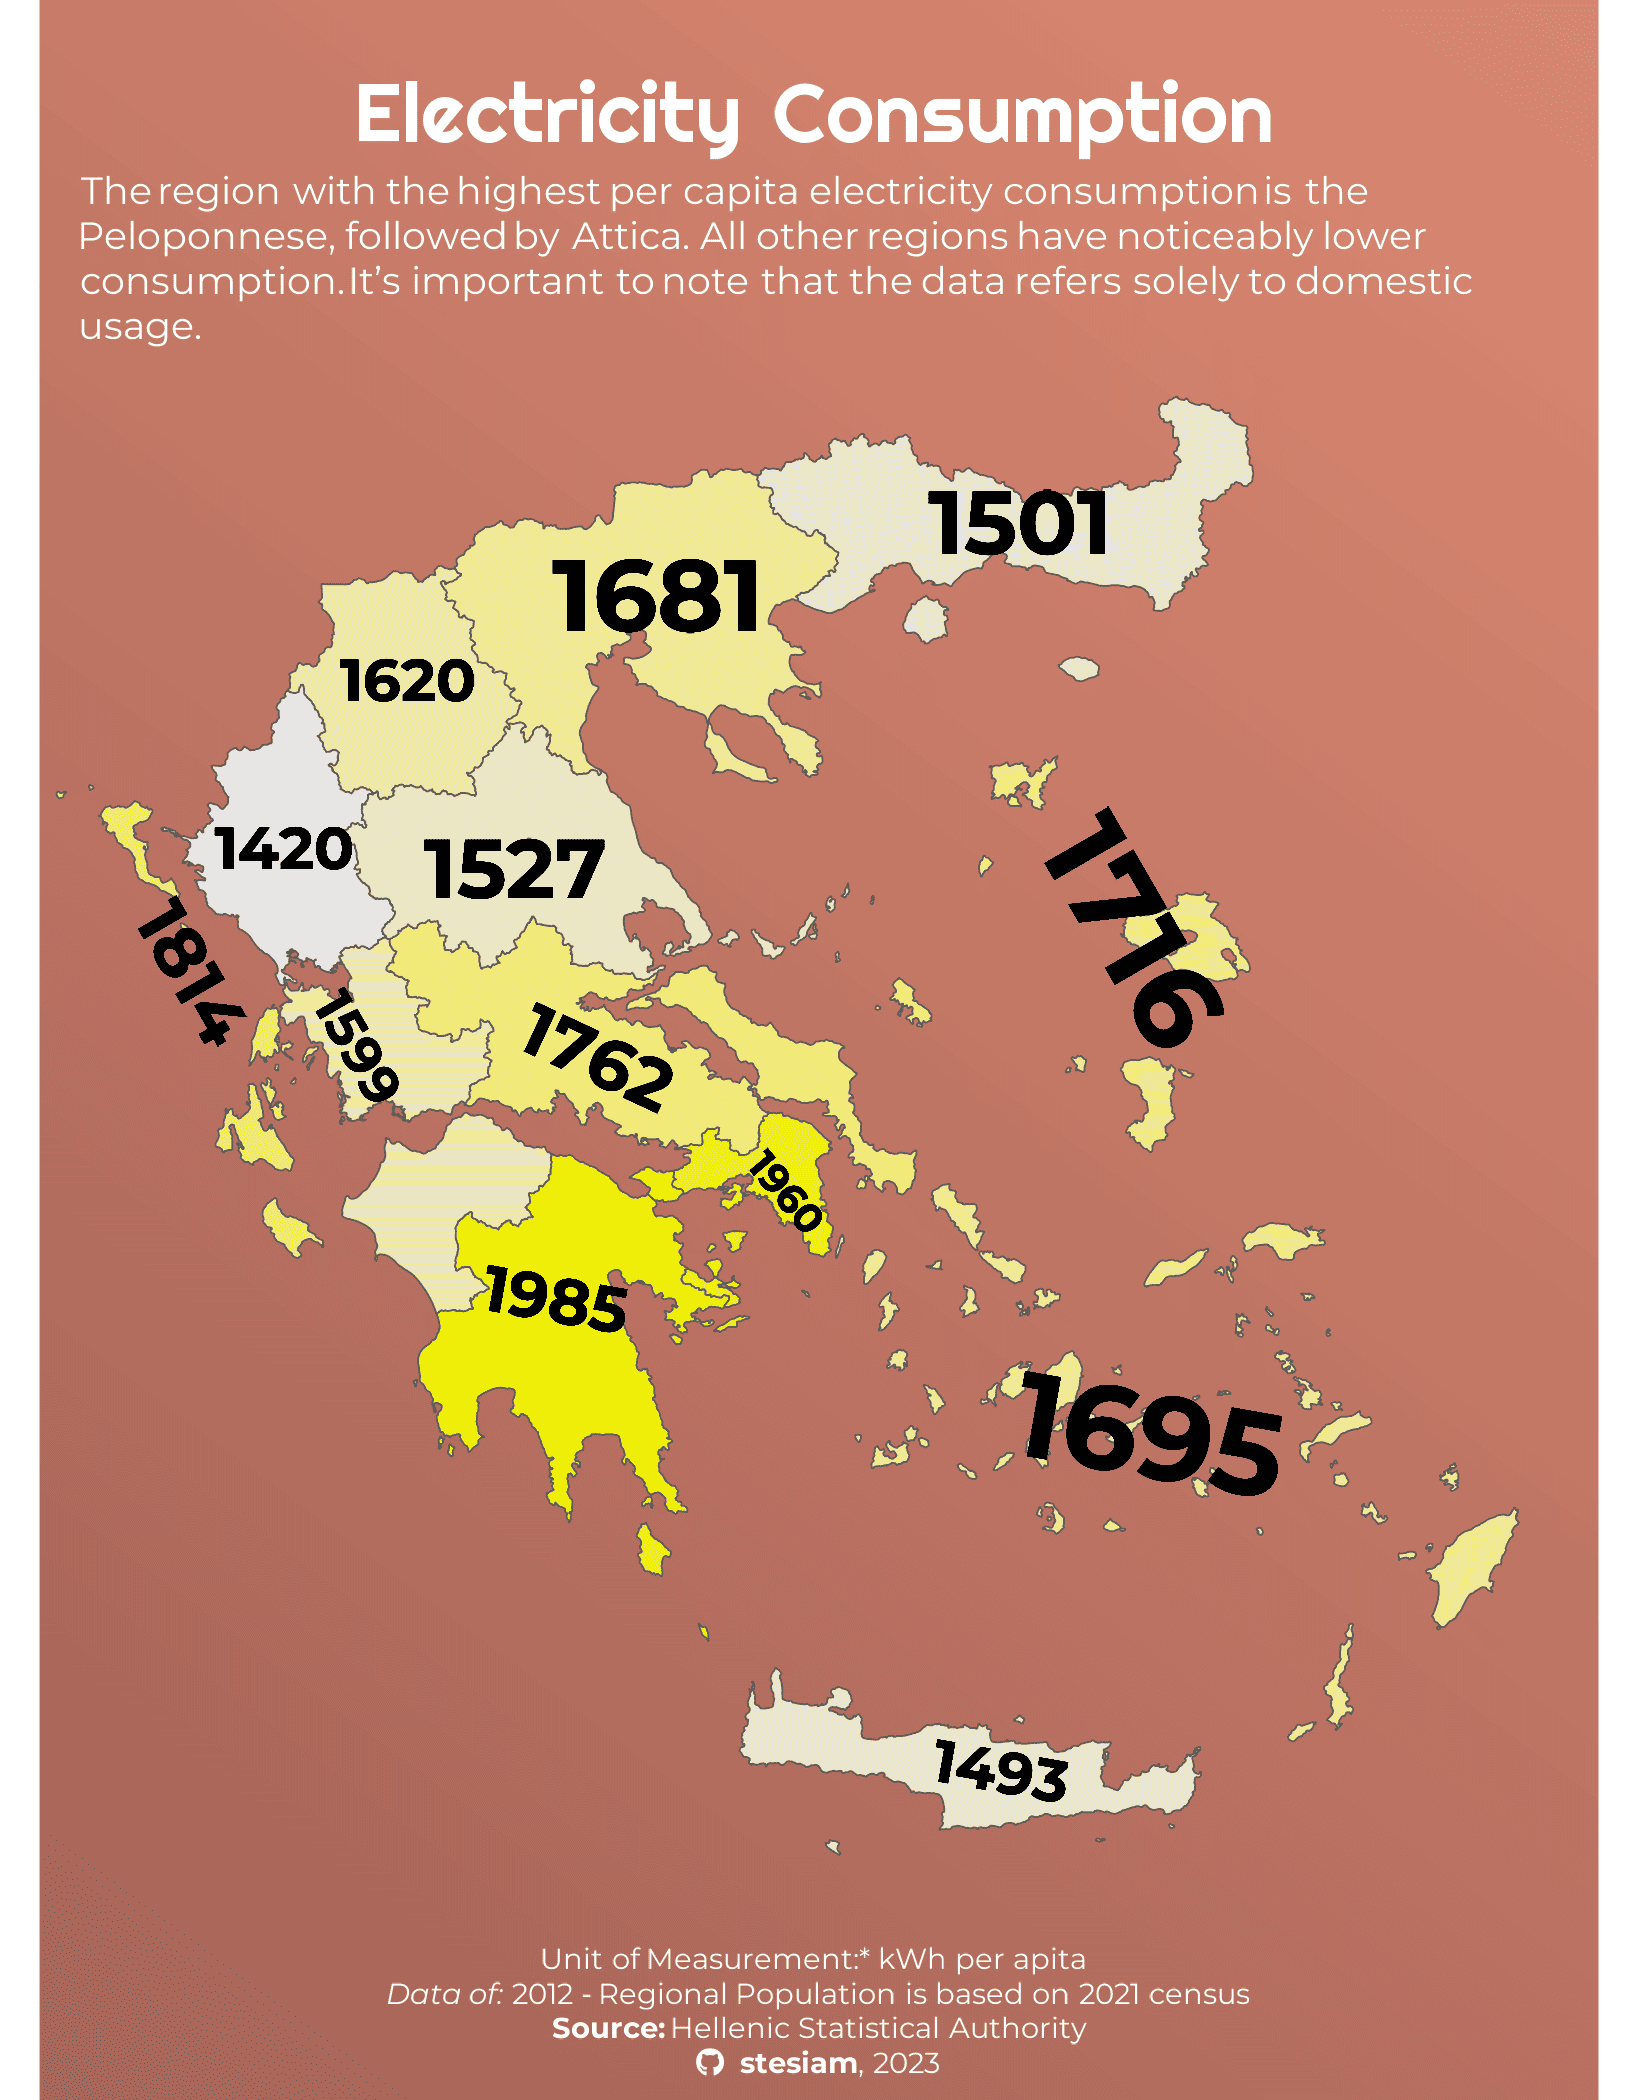
Electricity Consumption, 2012
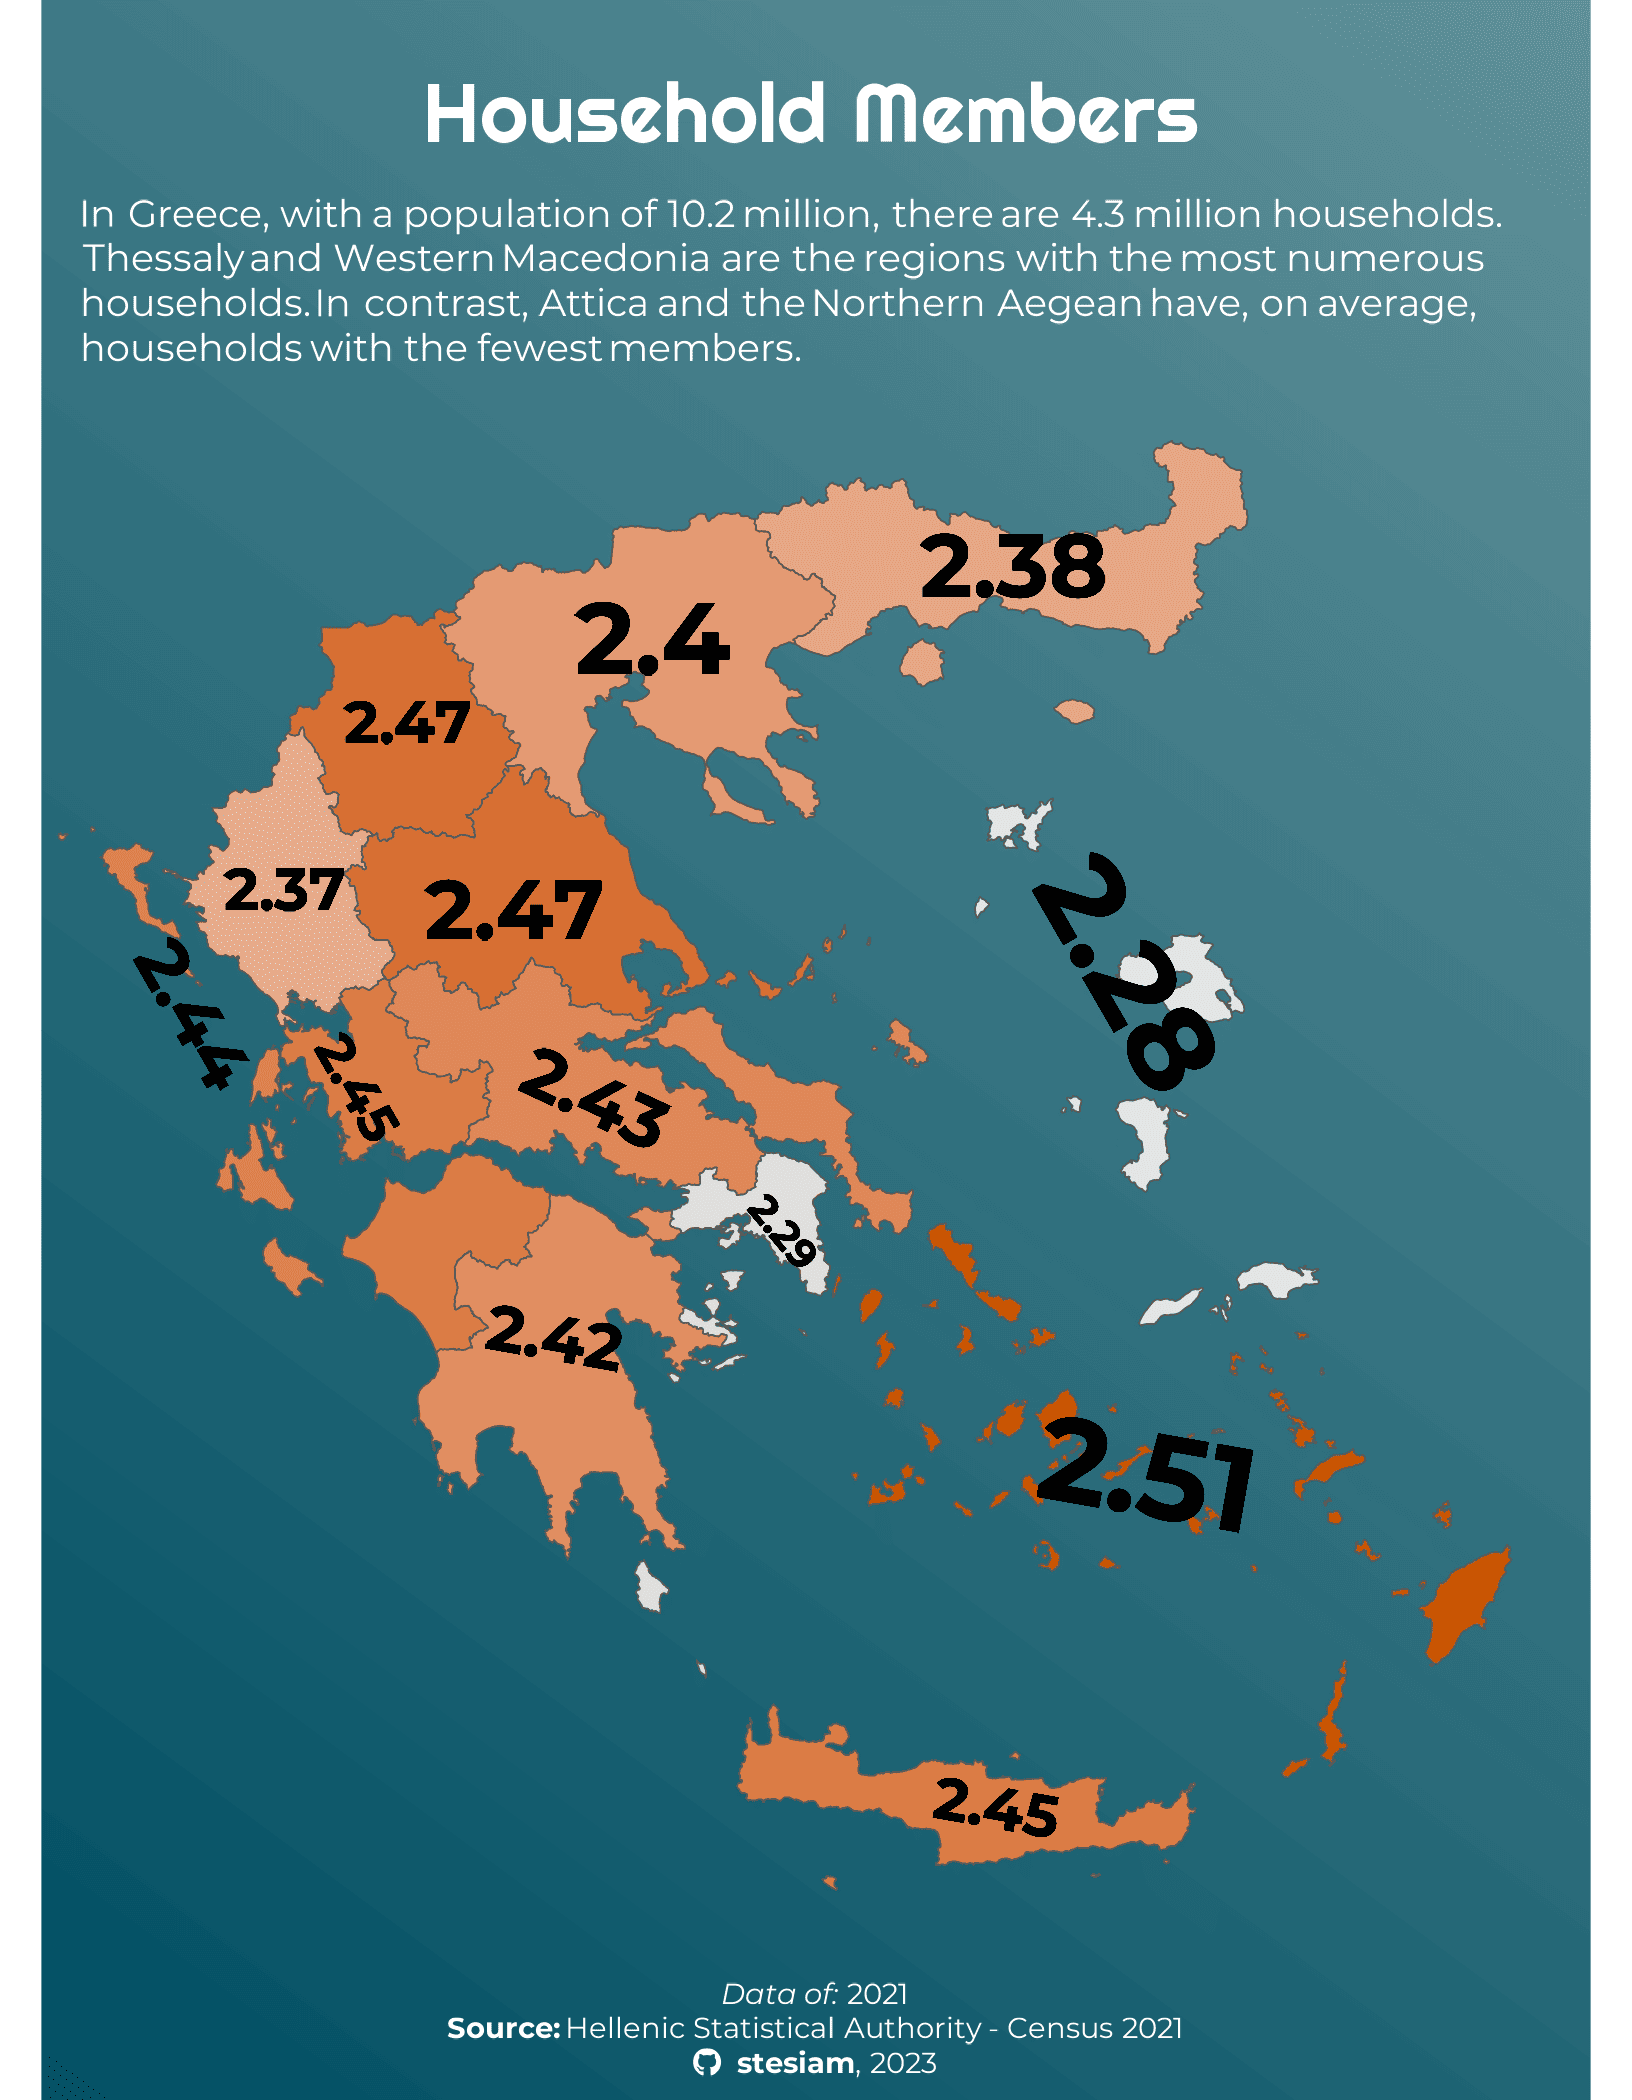
Household Size, 2021
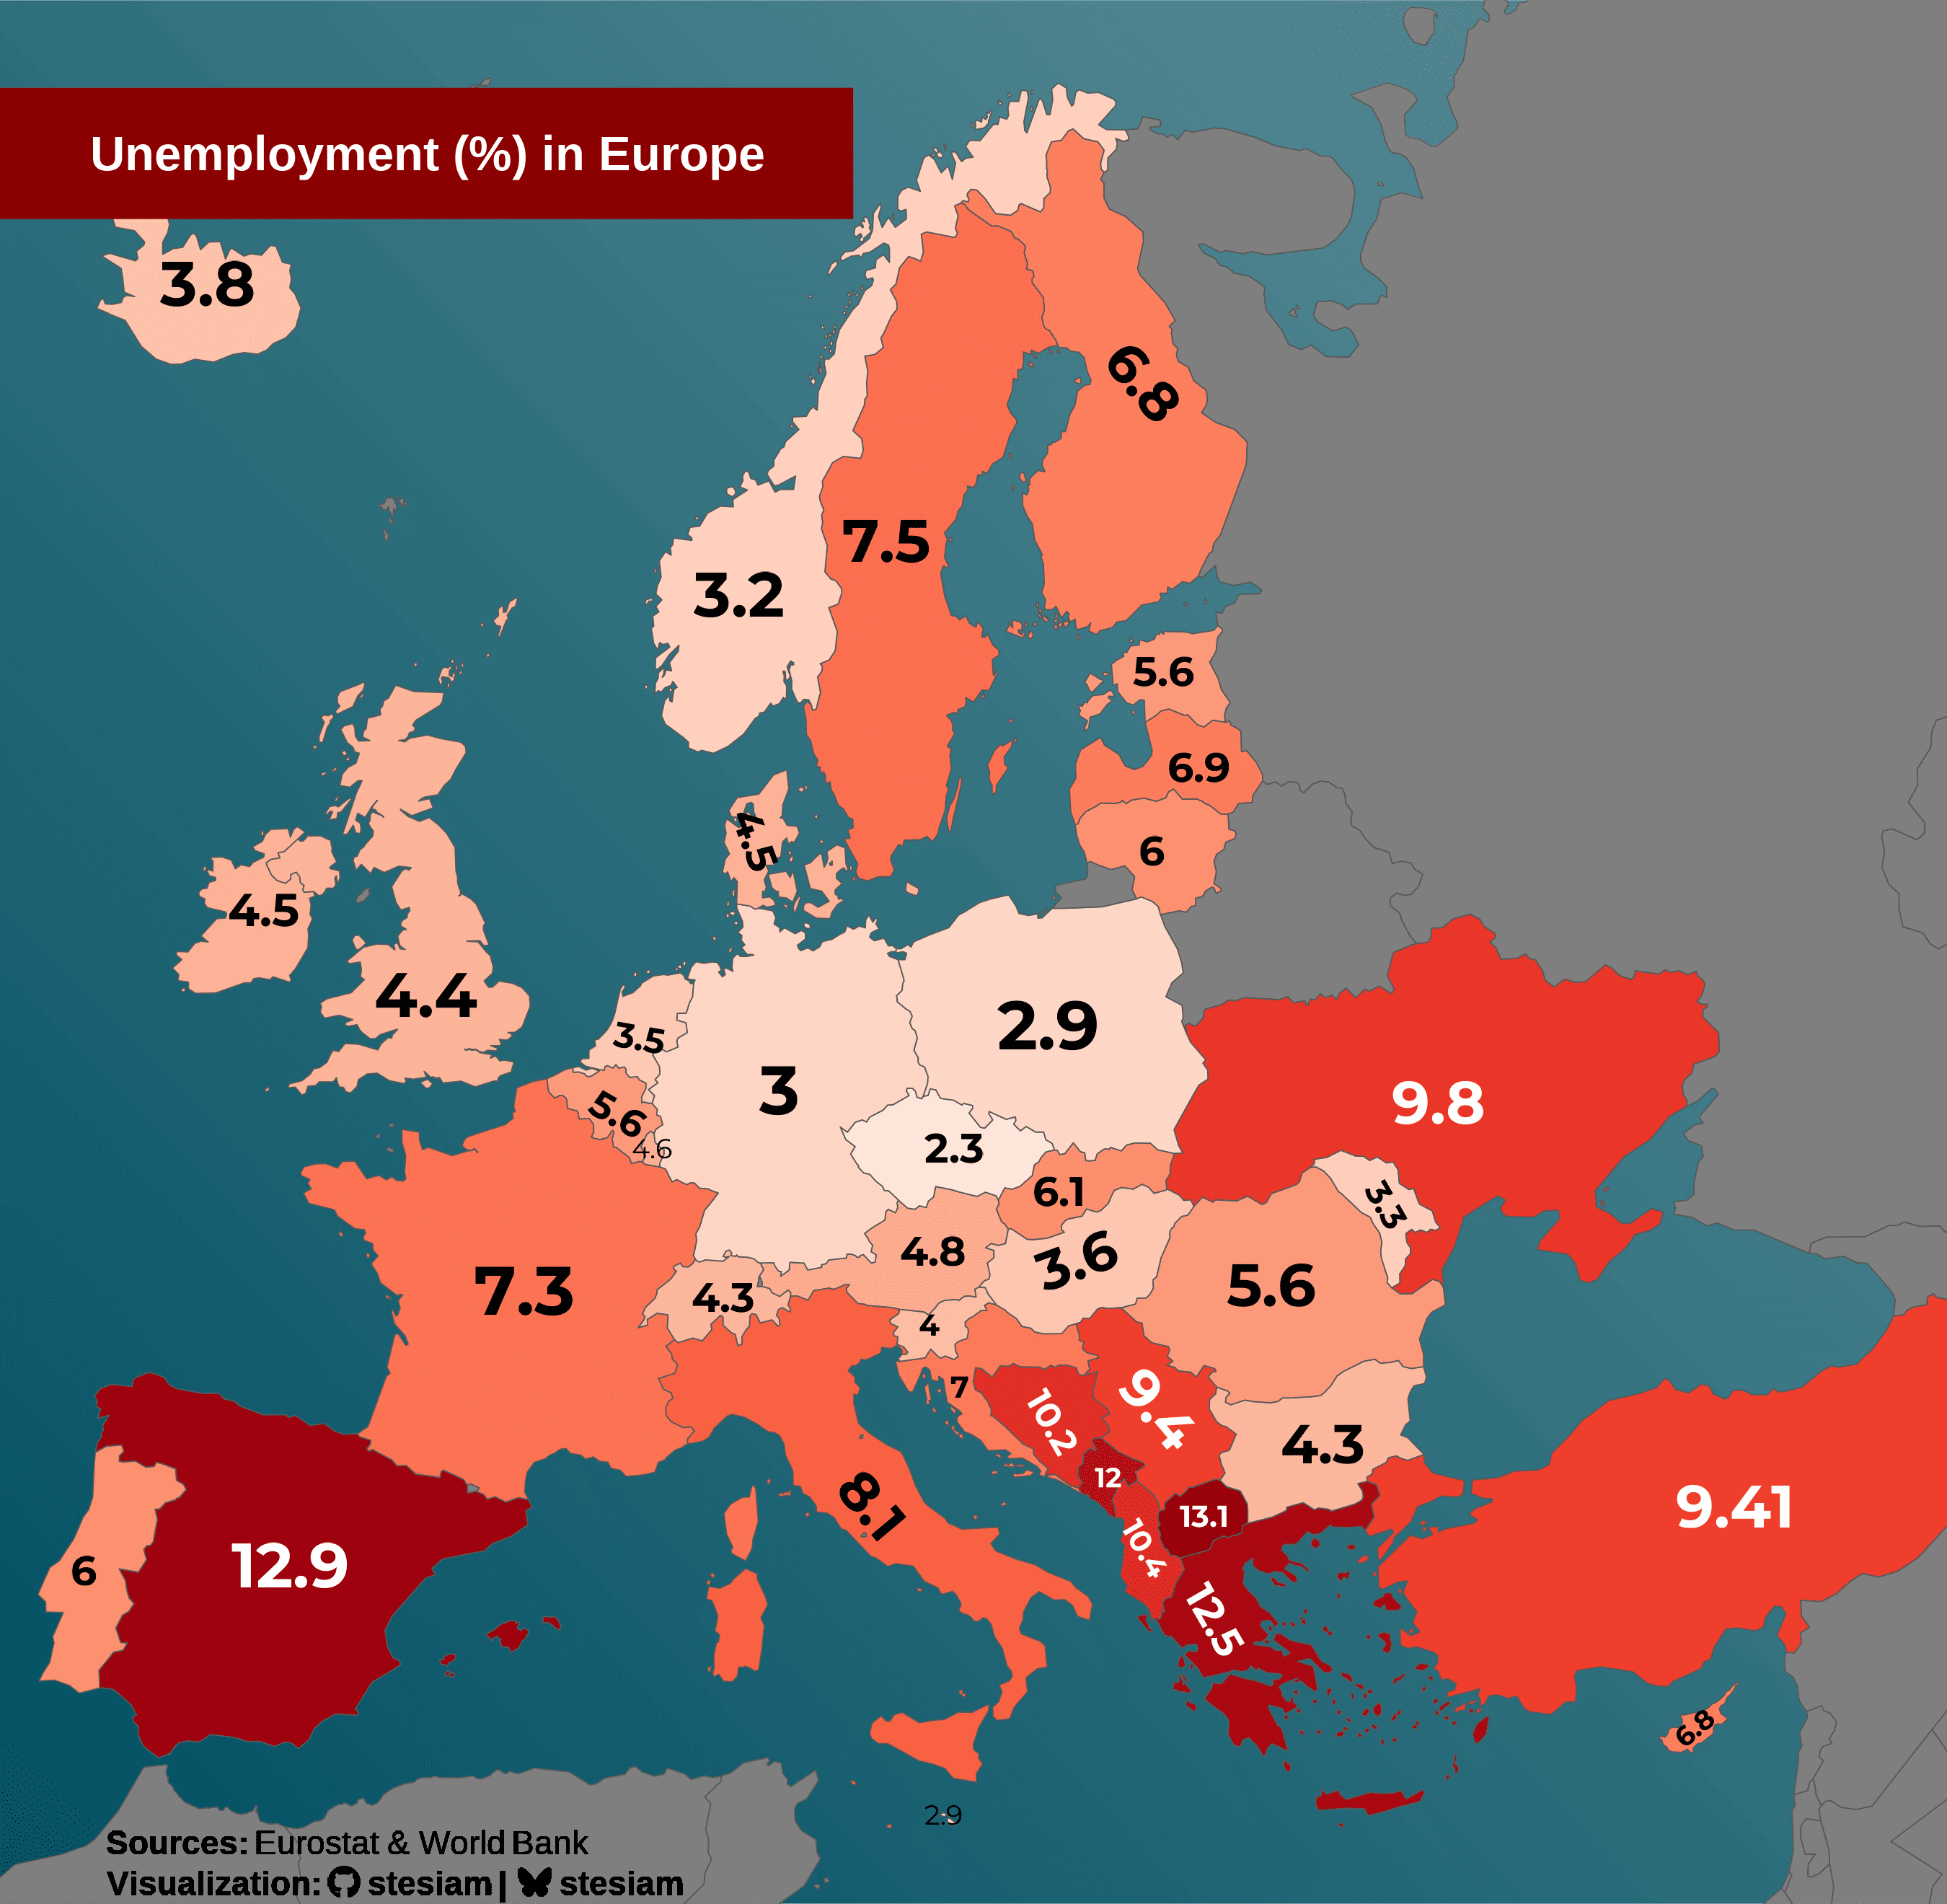
Unemployment, 2022
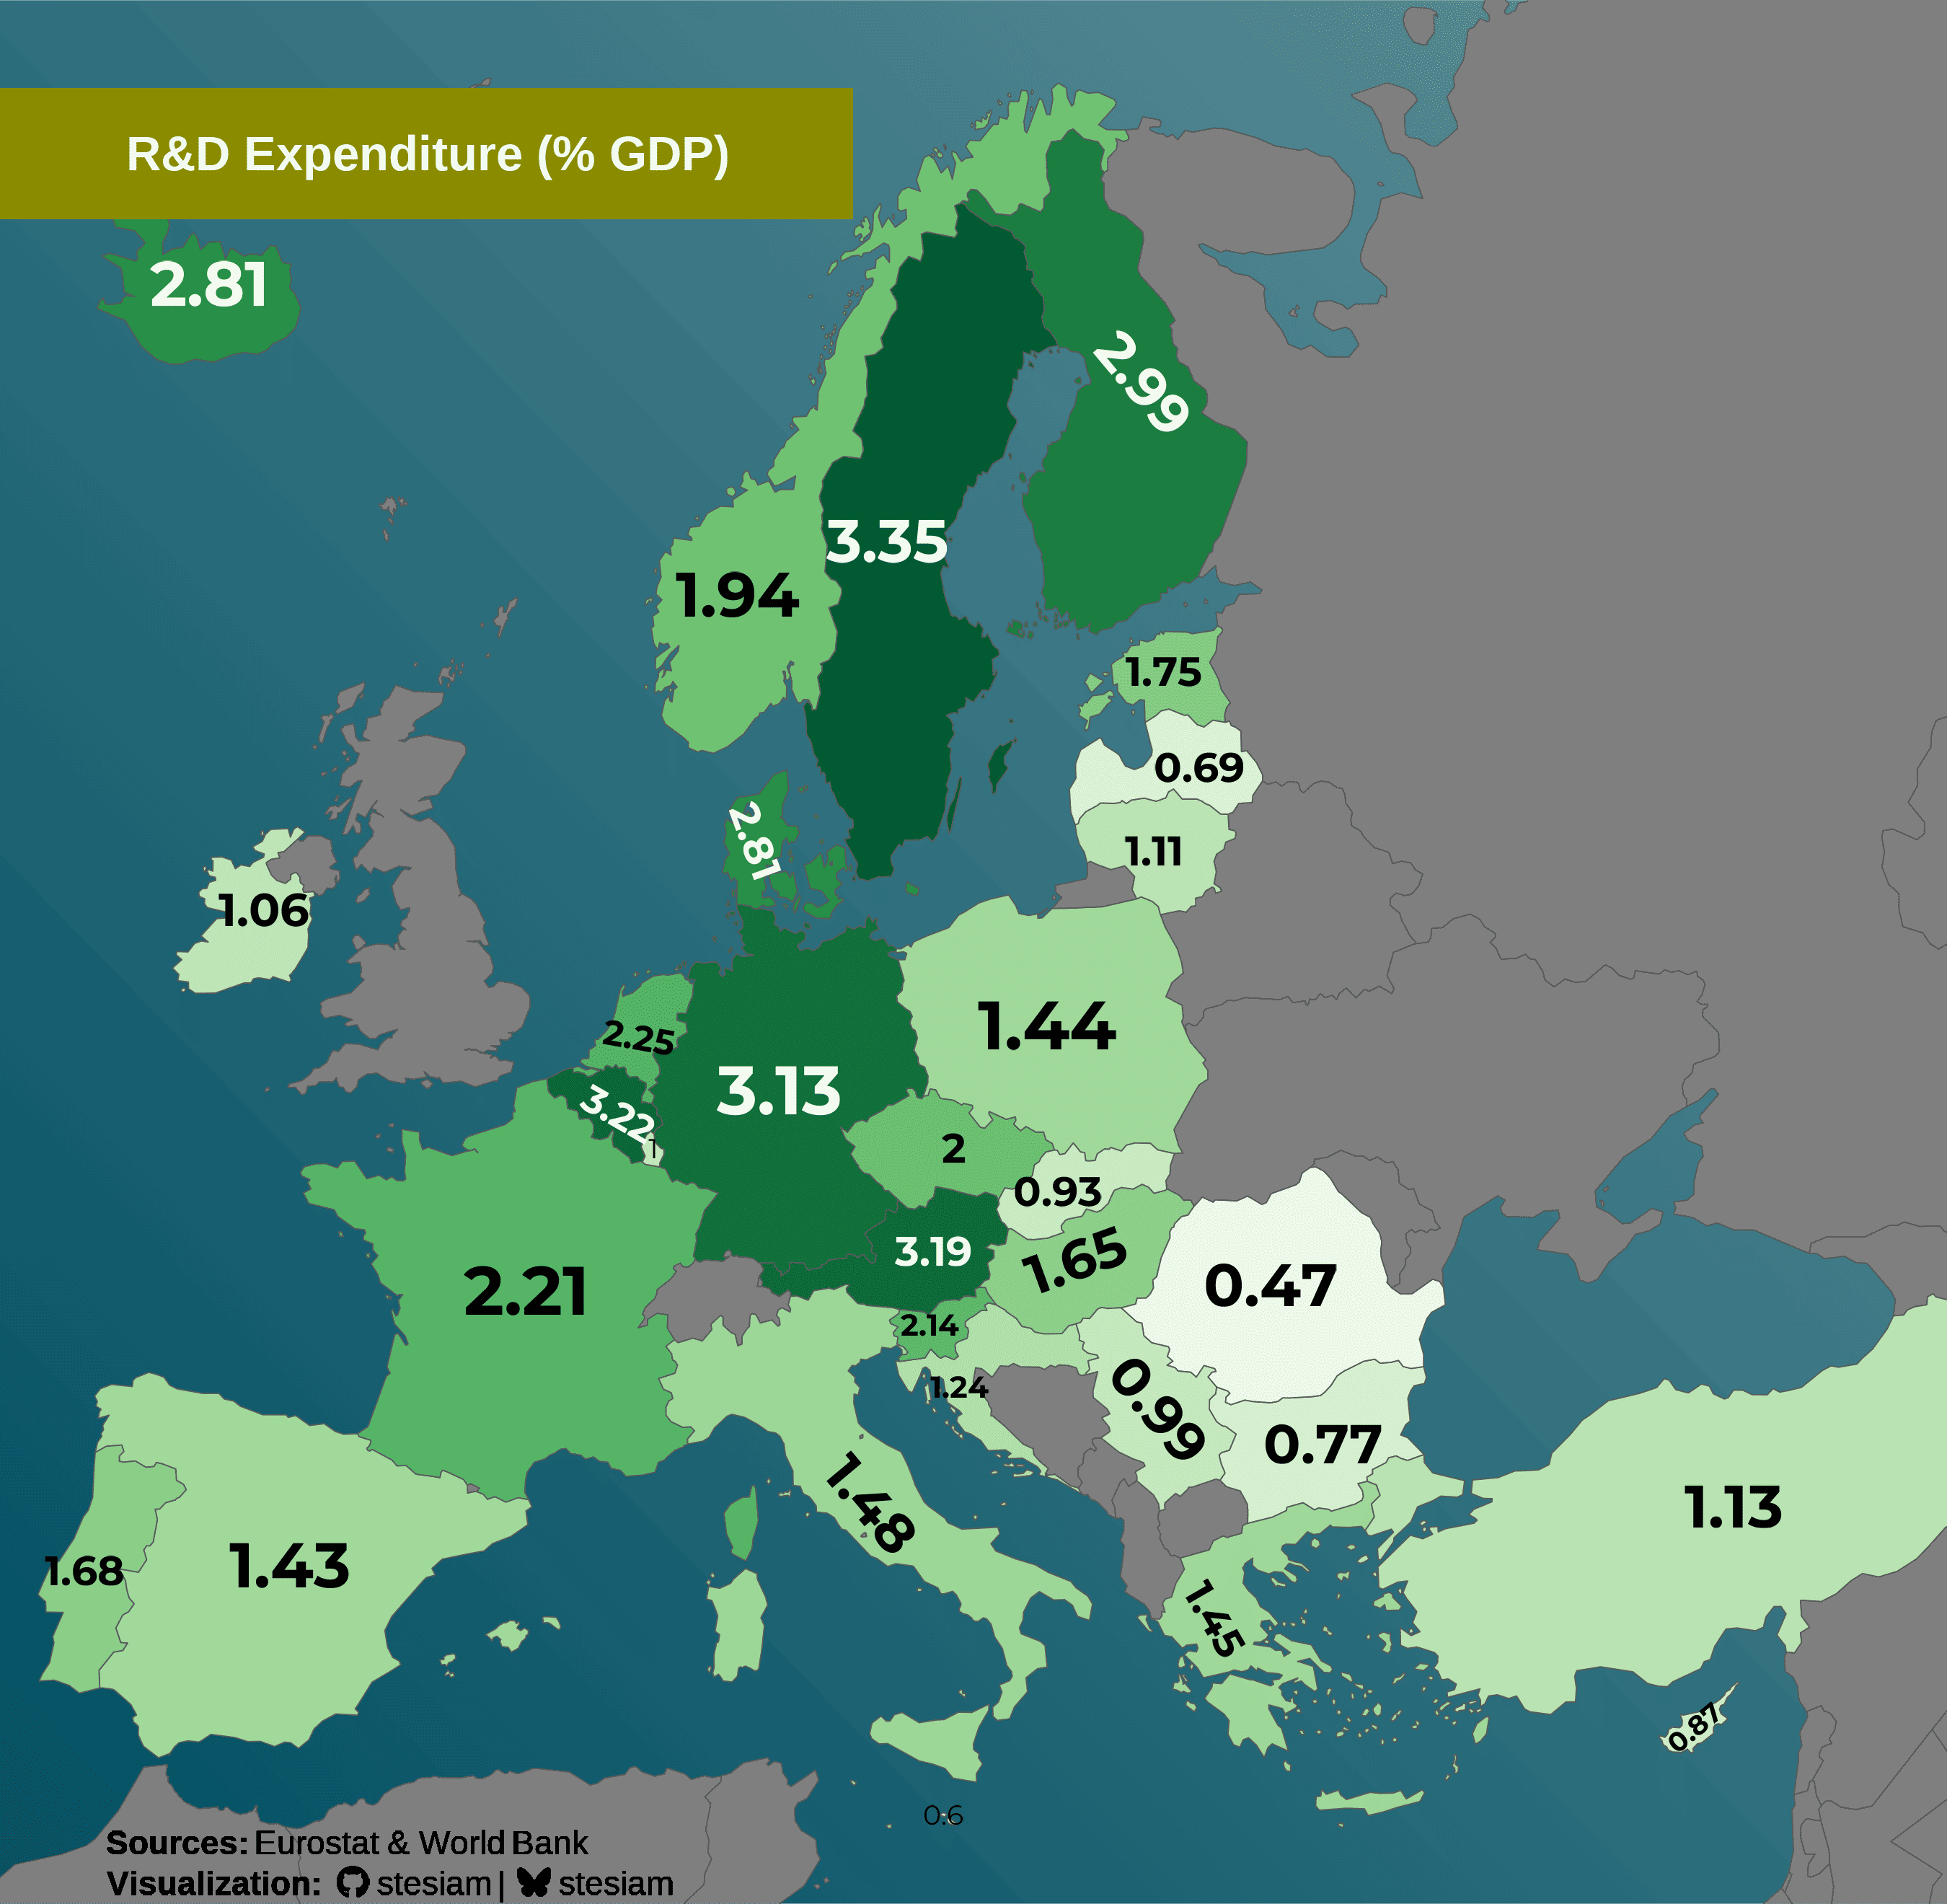
R&D, 2021
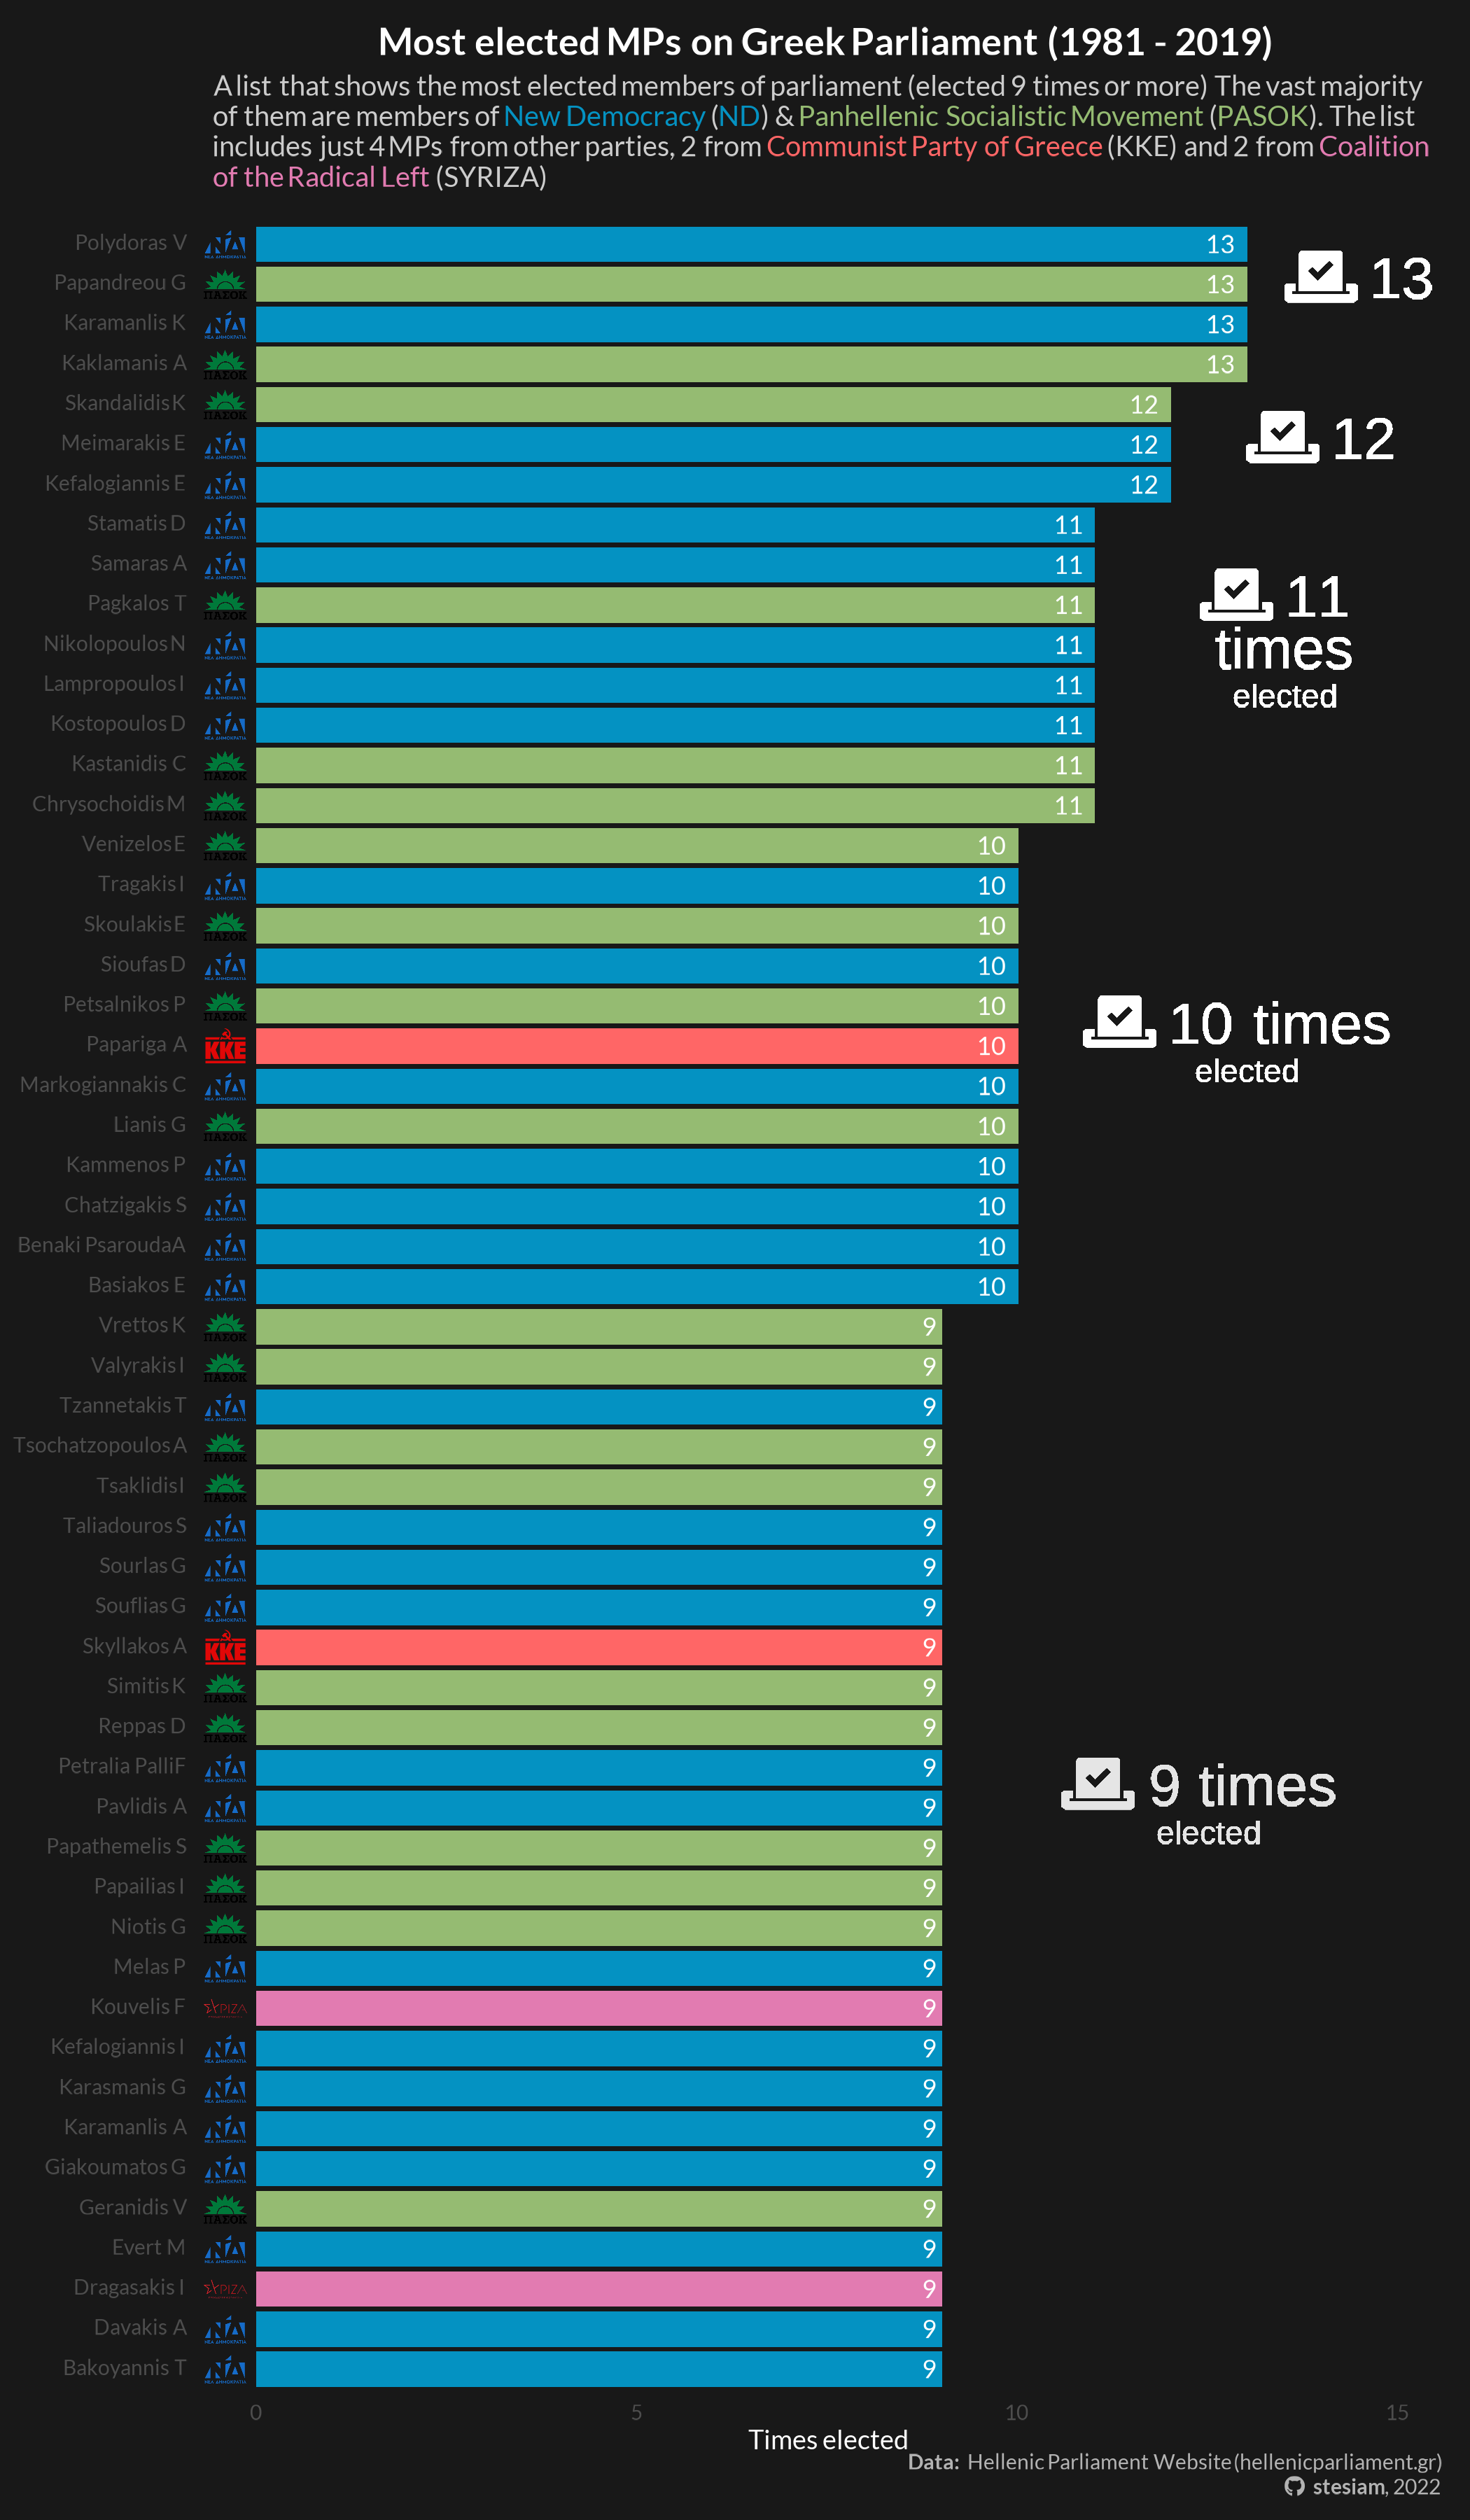
Most Elected MPs
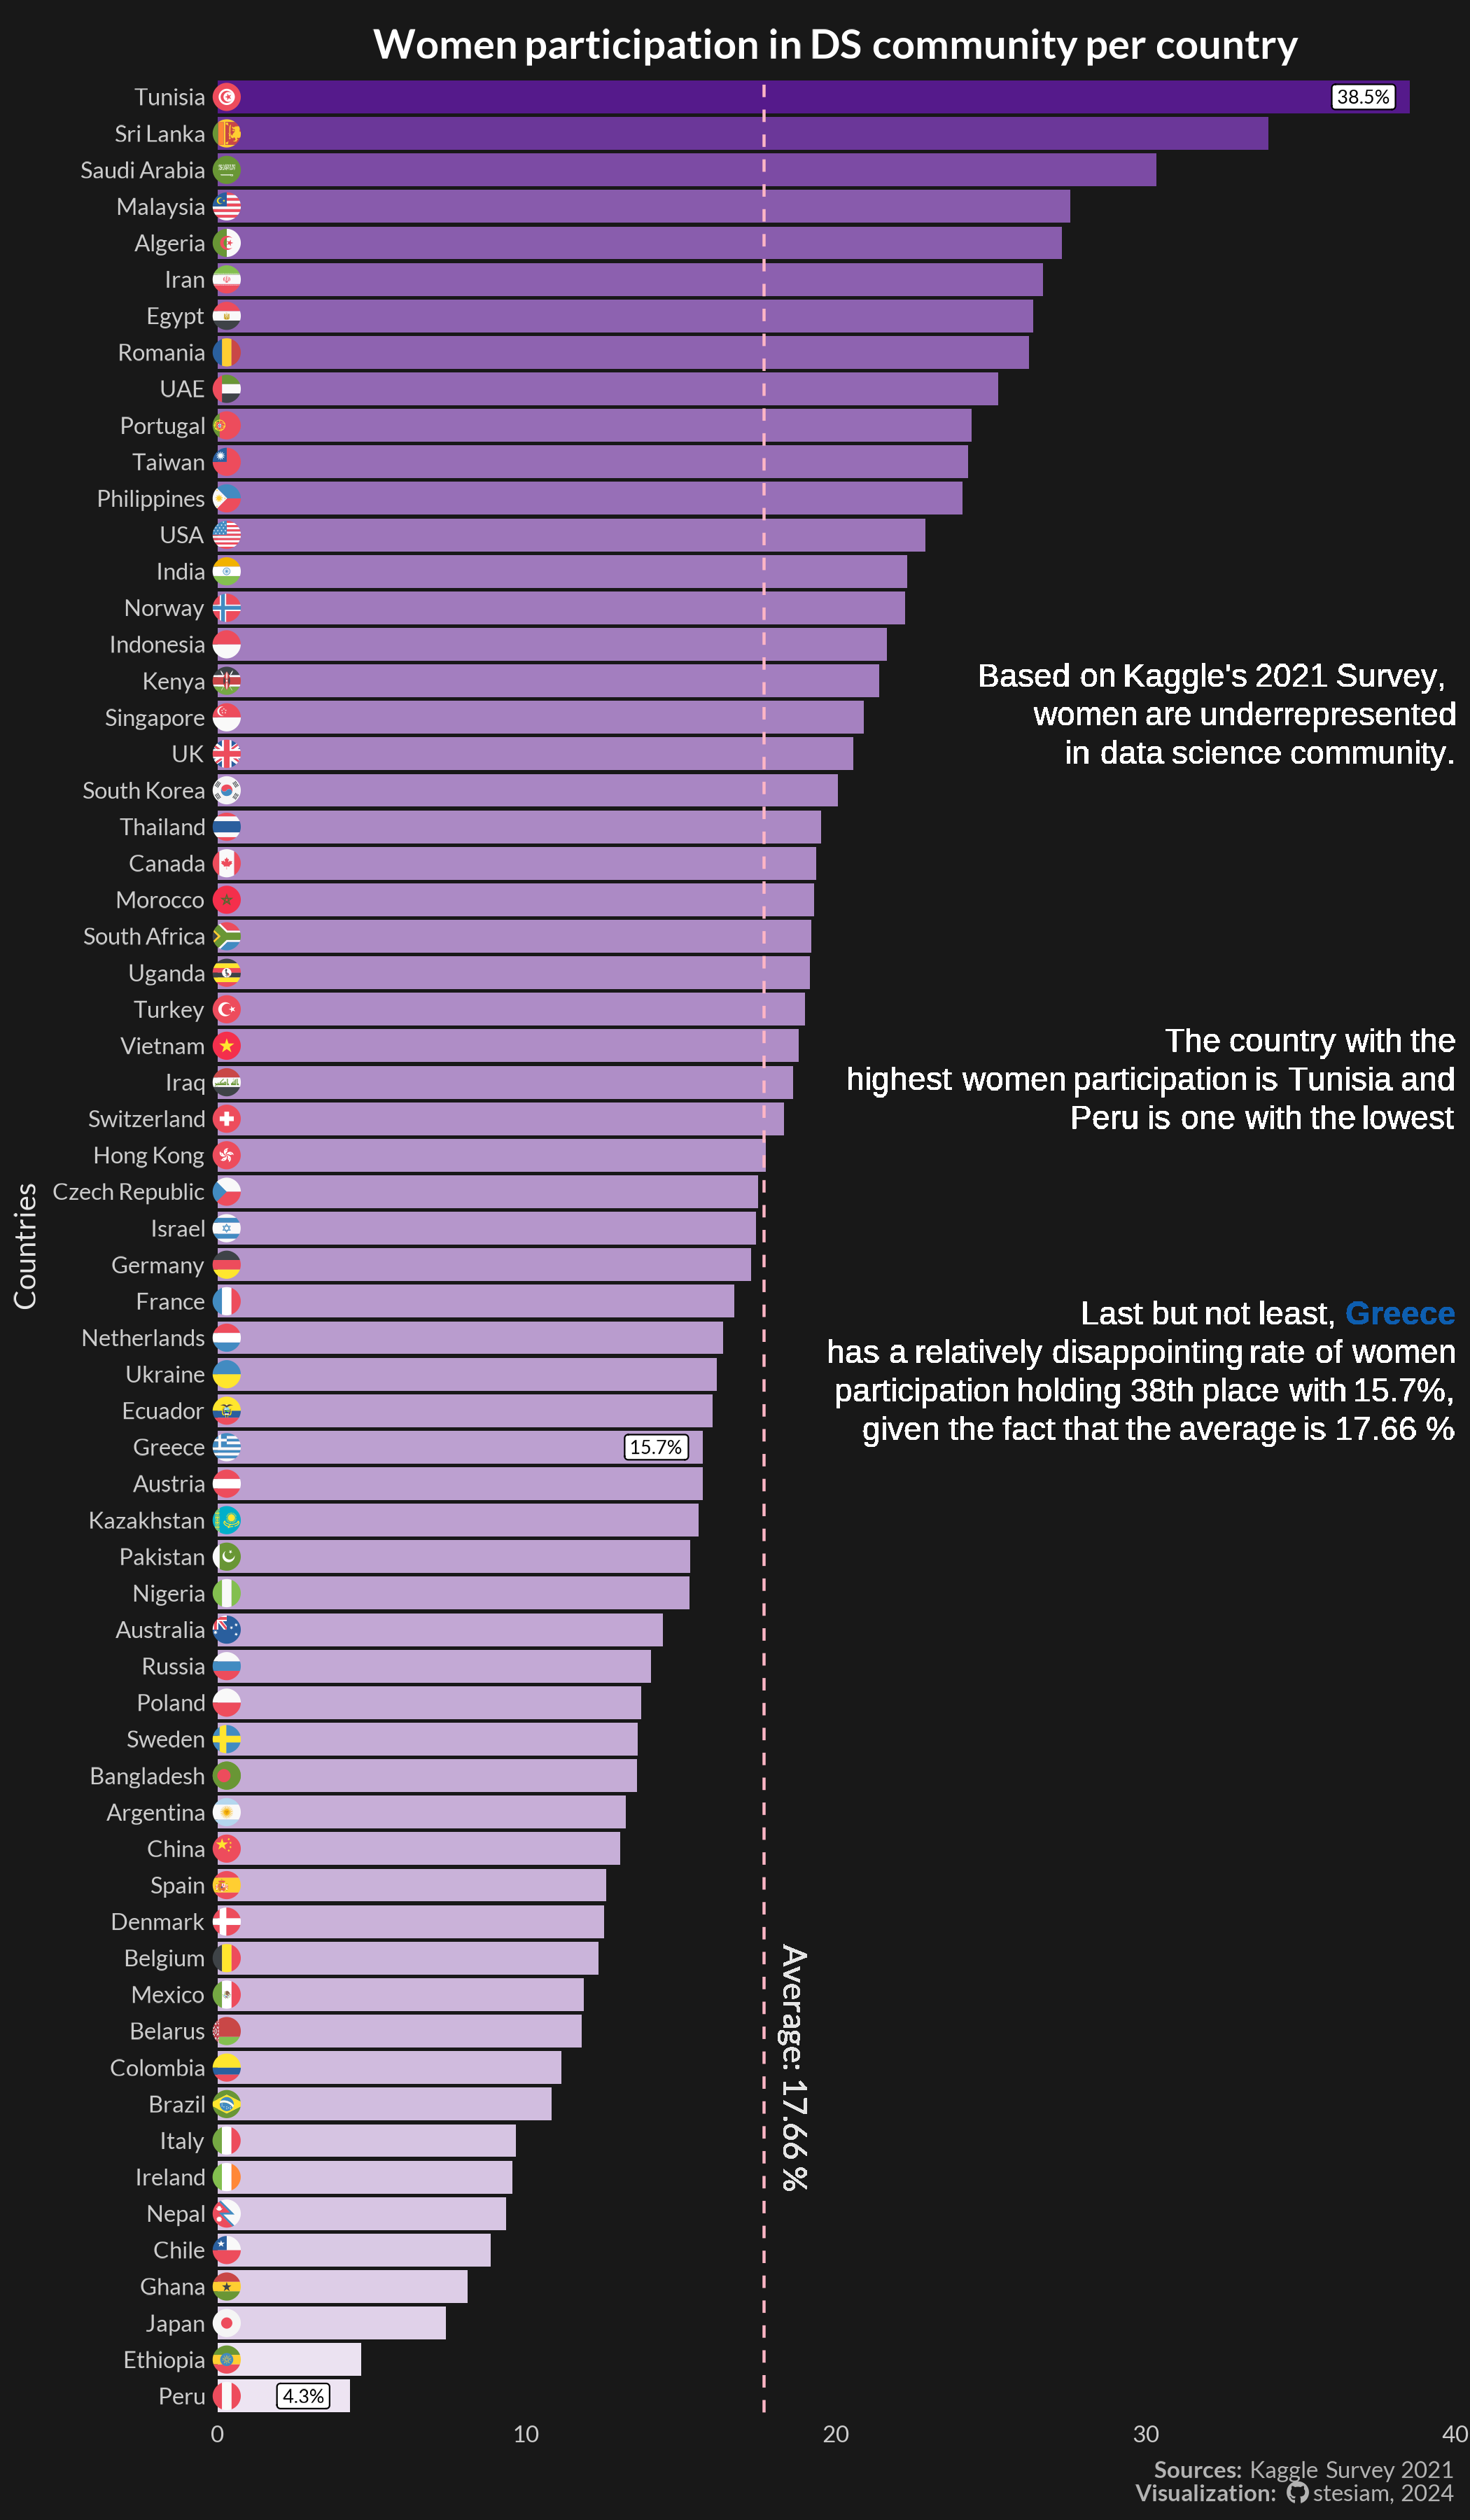
Women in Data Science

Age Distribution (GR & Rest of World)
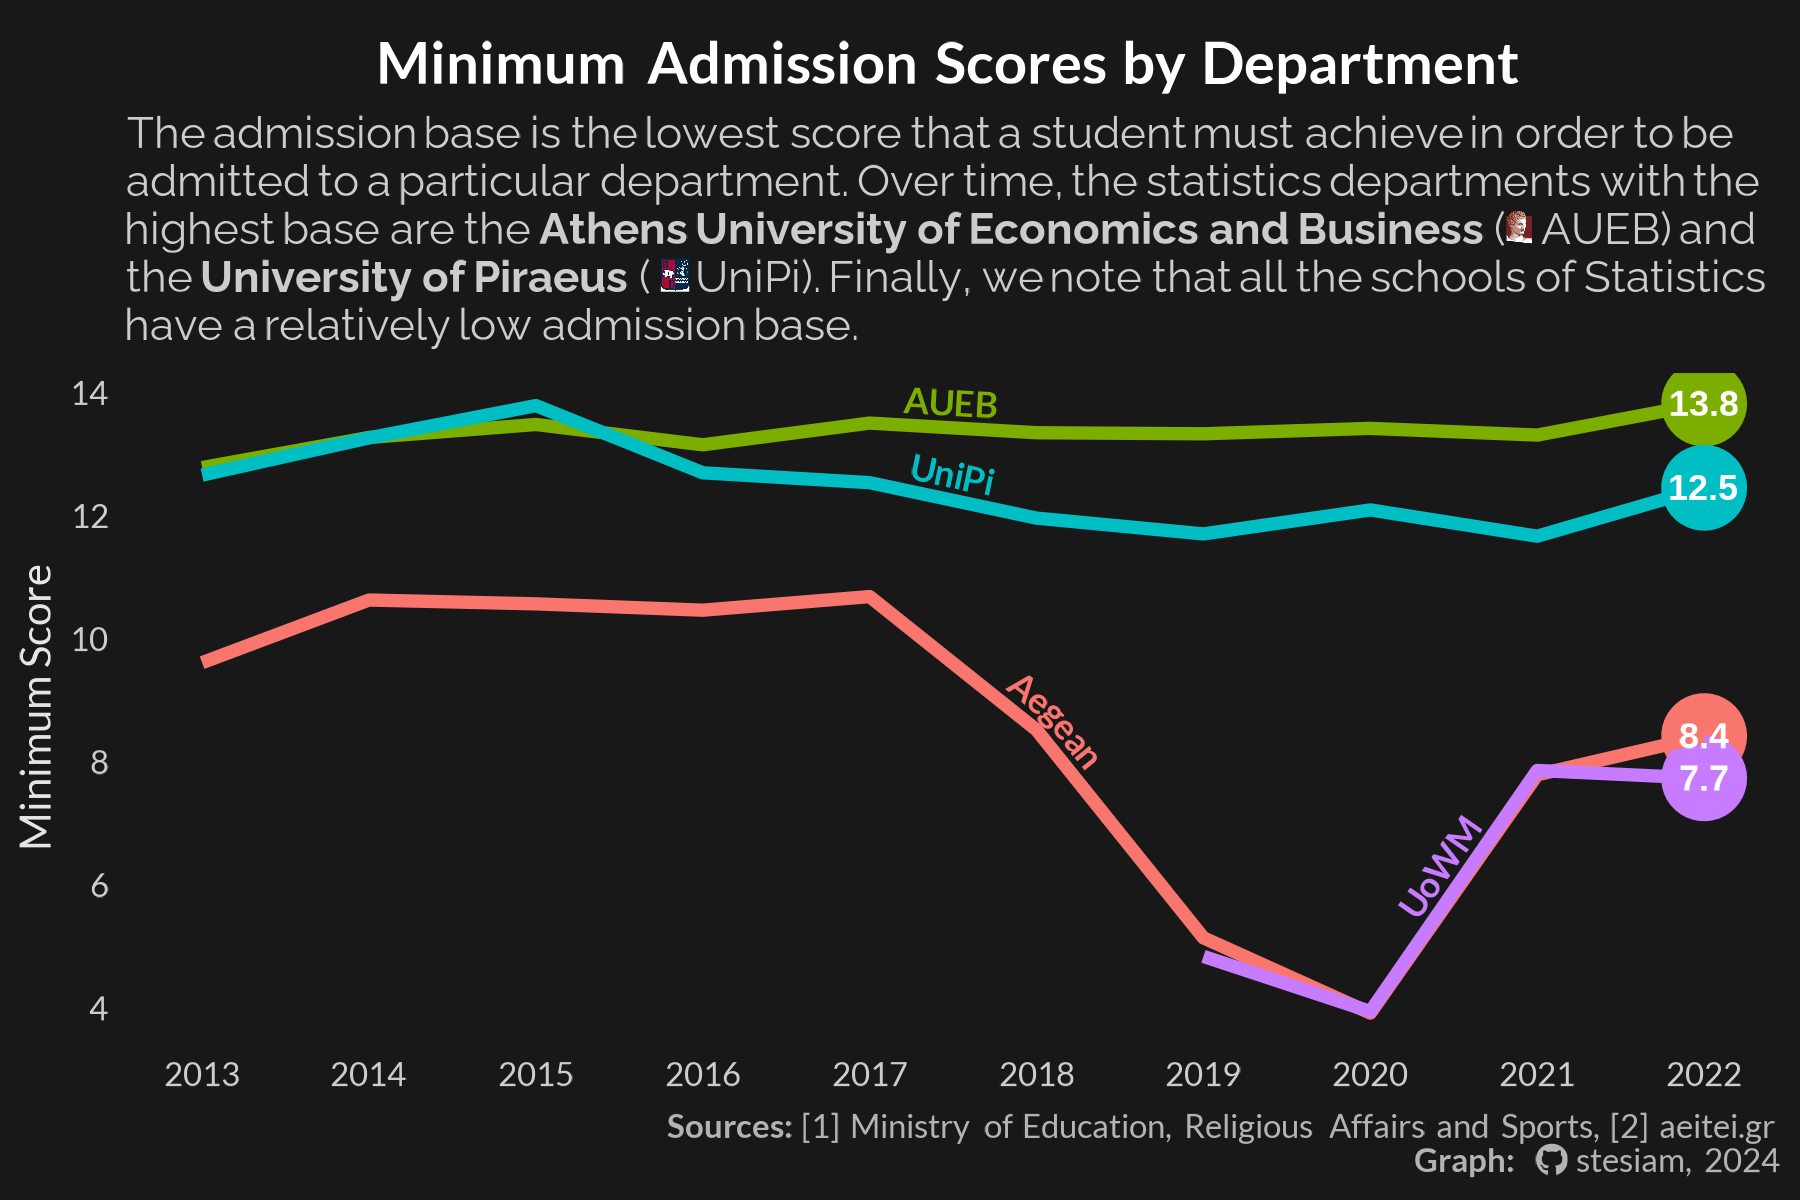
Statistics Depts Min. Admission Score

Admissions through Panhellenic Exams
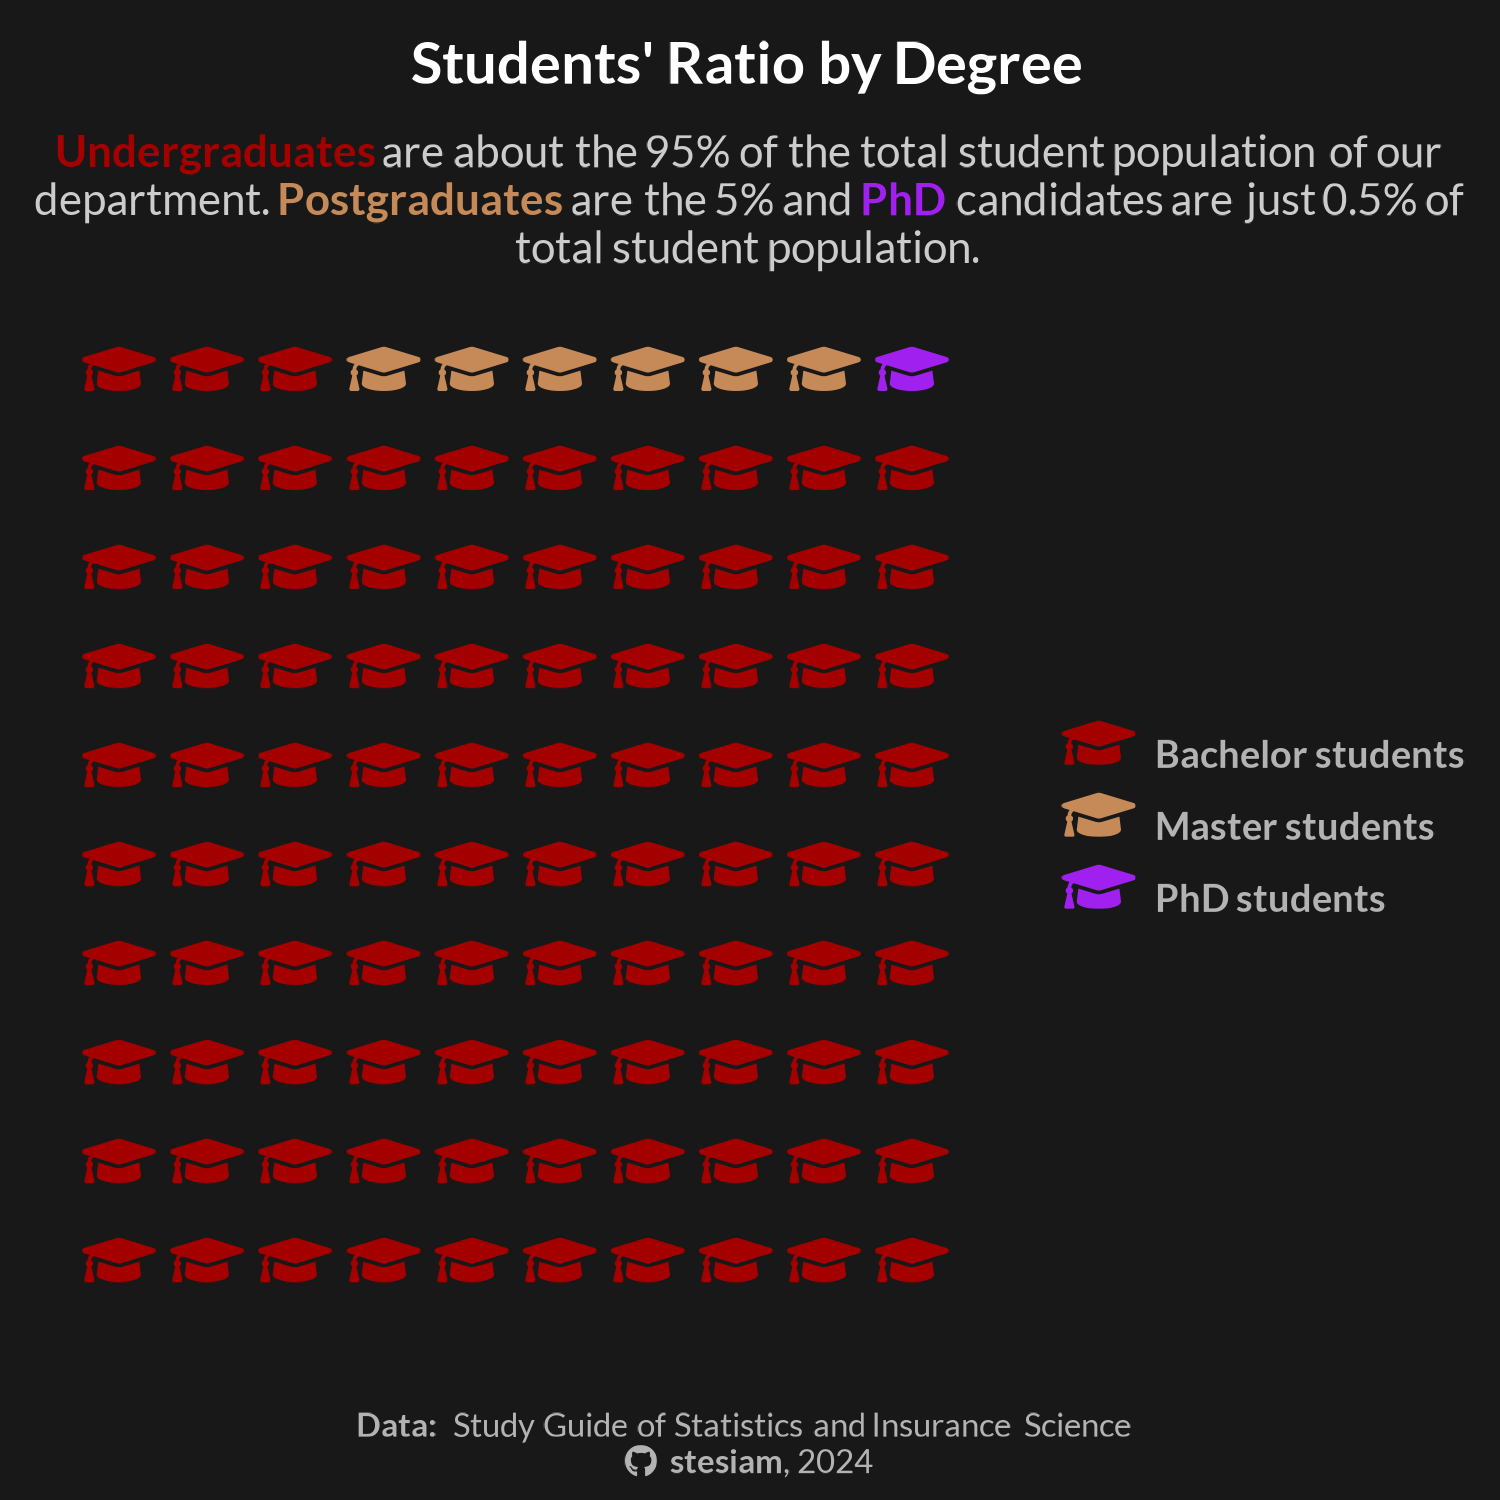
Structure of Student Population